Most traders who discover the KQSKX strategy builder for the first time open the settings panel and immediately close it again. It's not that they aren't smart enough — it's that they're looking at a professional-grade strategy construction system without a map. Hundreds of inputs. Logical groups. Signal modules with letters running A through F. Risk stops with acronyms they've never seen before. It looks intimidating because it is comprehensive, not because it is complicated.
The KQSKX — part of Krown's Quant Automation suite — is a TradingView strategy script built by Krown of Krown's Crypto Cave, one of the most respected technical analysts in crypto. Unlike a regular indicator that simply plots lines, a strategy script actively simulates trades using rules you define, then shows you exactly how those rules would have performed against real historical data: win rate, profit factor, drawdown, and more. What makes KQSKX exceptional is that Krown has pre-built every common signal type you'd ever need — trend crosses, patterns, divergences, thresholds, ranges, slopes, and cross-source comparisons — and combined them into a modular system you configure without writing a single line of code.
This guide covers every section of the KQSKX settings panel. By the end you'll understand exactly what each module does, why it exists, and how to configure a working strategy from scratch.
⚡ Key Takeaways — What You'll Know After Reading This
- KQSKX is a TradingView strategy builder by Krown that lets you build, backtest, and automate multi-condition crypto strategies without coding.
- Logical Groups (AND-A, OR) are the most important concept — they control how your signal conditions combine. AND requires all conditions to align; OR fires on any single condition.
- There are seven signal modules: Krown Cross, Patterns, Divergence, Thresholds, Ranges, Slopes, and External Sources — each targeting a different type of market analysis.
- The ER Risk Stop places your stop at actual swing highs/lows rather than arbitrary percentages — structurally meaningful and generally superior for crypto.
- Always backtest with 0.06% commission and slippage. A strategy with no edge at 0% fees has no real edge at all.
- The R:R Take Profit setting (set to 2:1) means you only need to win 34% of trades to break even — proper risk-reward compounds powerfully over time.
- Break-even stops eliminate the possibility of a winning trade turning into a loss — one of the most valuable protections in the tool.
📋 What's In This Guide
- What Is the KQSKX and Why Does It Matter?
- The Four Tabs: Inputs, Properties, Style, Visibility
- The Logical Groups System — The Most Important Concept
- Signal Module: Krown Cross
- Signal Module: Patterns
- Signal Module: Divergence
- Signal Module: Thresholds A–E
- Signal Module: Ranges A–E
- Signal Module: Slopes A–D
- Signal Module: External Sources A–F
- Risk Management: Basic, ER, and ATR Stops
- Optimization Controls
- Break-Even, Entry Cool Down, and Pyramiding
- Multiple Exits, Date/Time Filters, and Alerts
- Properties Tab: Getting Your Backtest Right
- Your First Simple Strategy
- Frequently Asked Questions
- Quick Glossary
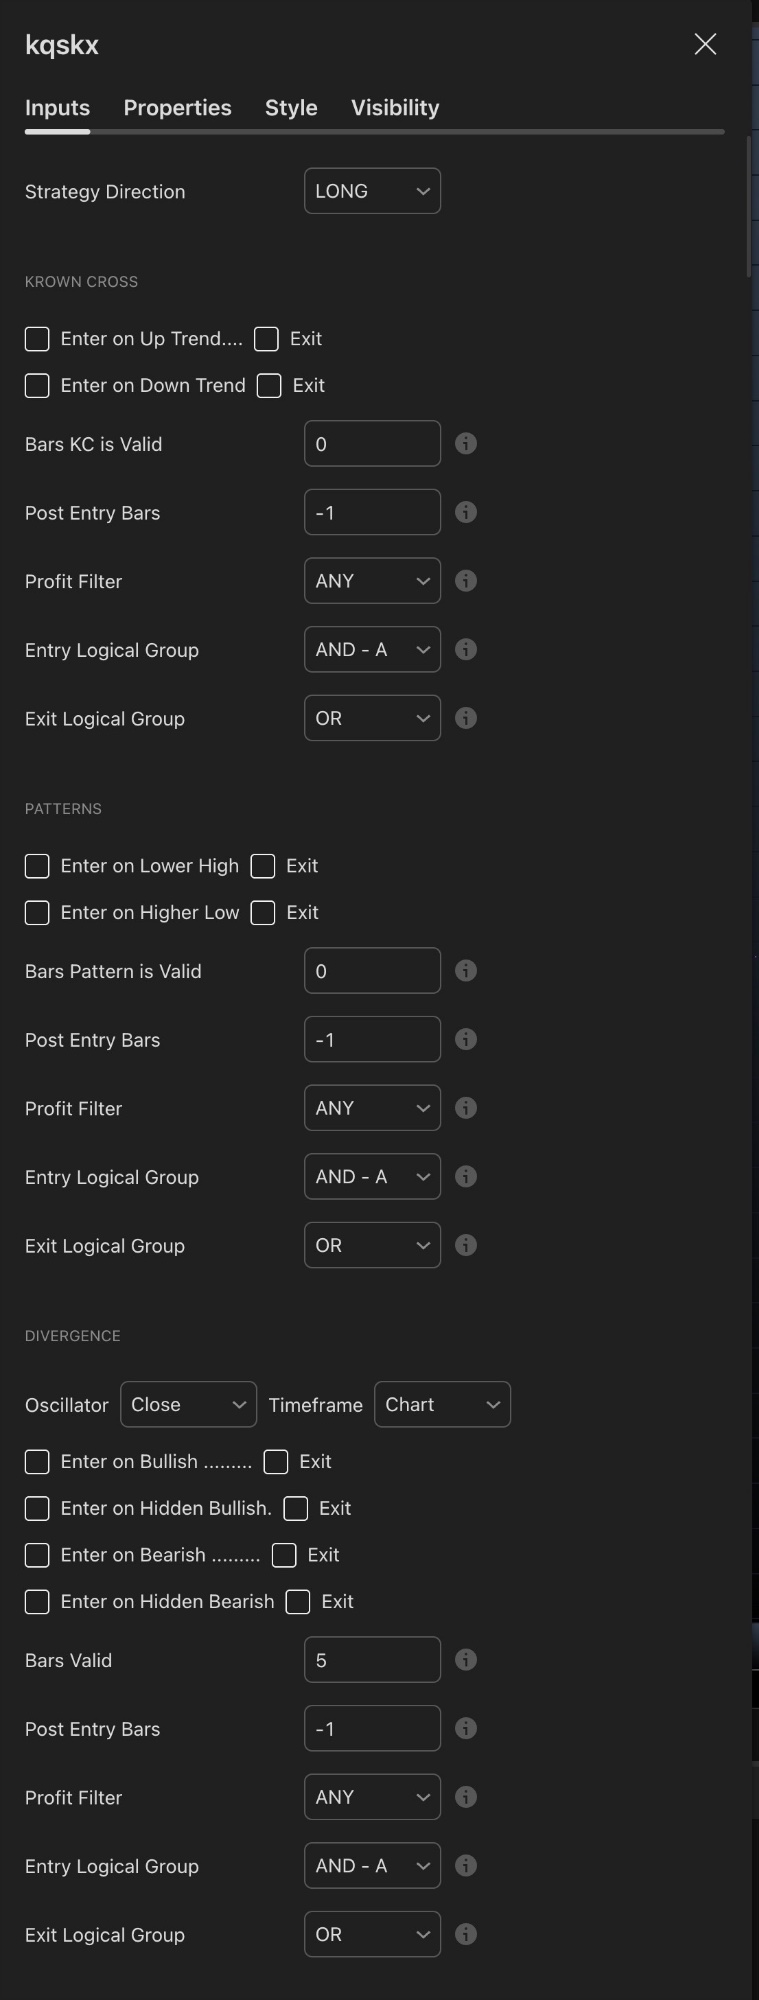
The top of the KQSKX Inputs panel — Strategy Direction, Krown Cross, Patterns, and Divergence modules all visible in one scroll
What Is the KQSKX and Why Does It Matter?
The KQSKX (sometimes called the Skeleton Key X) is a strategy framework that lives inside TradingView. It's part of Krown's paid Quant Automation subscription, which also includes his proprietary indicators — the Krown VMP, Krown Stochastics, and Krown Fibonacci — plus a private Discord with over 150 shared strategy templates and support for automated bot execution via services like Alertatron. Over 4,000 traders globally use the platform.
The key insight is this: most traders have a general idea of what conditions they'd want to see before entering a trade. "I want the trend to be up, the RSI to be in a certain zone, and I want to see divergence confirming momentum." The KQSKX lets you formalise those ideas, test them against years of real price data in minutes, and then execute them automatically while you're away from the screen.
💡 The Core Concept
Think of KQSKX like a checklist for entering a trade. You decide: "I only want to enter a long when all three of these conditions are true at the same time." The tool checks those conditions on every historical bar, fires entries wherever they align, and tells you exactly how that strategy performed. Then you adjust and improve it before going live.
The Four Tabs: Inputs, Properties, Style, Visibility
When you open the KQSKX settings, four tabs run across the top. The vast majority of your work happens in the first two.
| Tab | What It Controls |
|---|---|
| Inputs | All strategy logic — signal modules, risk settings, optimization, entries and exits. This is where you build your strategy. |
| Properties | The backtest simulation environment — starting capital, commission, slippage, order size. Critical for realistic results. |
| Style | Visual appearance of signals on the chart — colours, shapes, line weights. |
| Visibility | Which chart timeframes the strategy is visible on. |
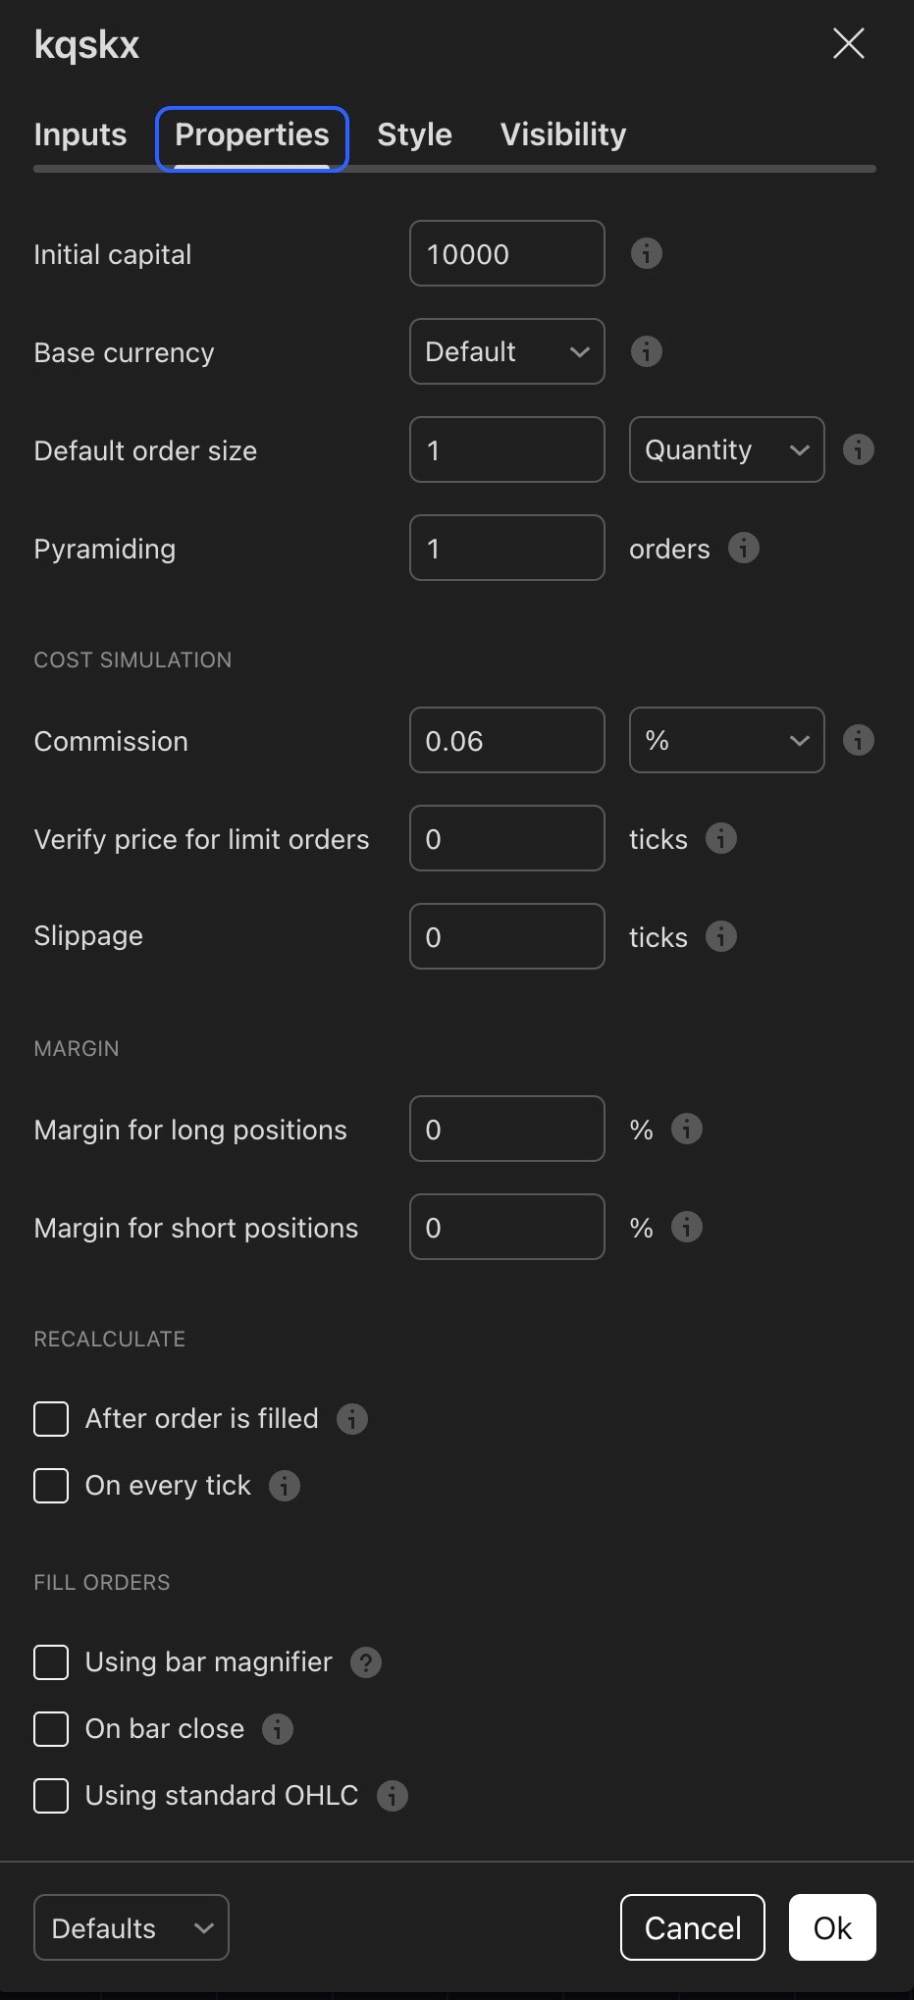
The Properties tab — always configure commission, initial capital, and order size here before running any backtest
The Inputs tab scrolls vertically through: Strategy Direction, Krown Cross, Patterns, Divergence, Thresholds (A–E), Ranges (A–E), Slopes (A–D), External Sources (A–F), Limit Entry, Risk, Optimization, Break-Even, Pyramiding, Multiple Exits, Date/Time Filter, Plot, and Alerts. We'll cover all of them.
The Logical Groups System — The Most Important Concept
Before touching any individual signal, you need to understand Logical Groups — because they control how your signals interact with each other. This is the architecture of your strategy, and getting it right is the difference between a strategy that fires on every noise spike and one that only enters on genuine confluences.
Every signal module has two dropdowns at the bottom: Entry Logical Group and Exit Logical Group. The options are AND-A, AND-B, AND-C (and further letters), and OR.
AND Groups (AND-A, AND-B…)
All signals in the same AND group must be true simultaneously for an entry to trigger. Creates high-confluence, filtered strategies with fewer but higher-quality entries.
OR Group
Any single OR signal firing is enough to trigger on its own. Creates more frequent signals — most useful for exits where you want multiple escape routes.
The most powerful application is building a multi-condition AND-A strategy: "Enter long only when the Krown Cross gives an uptrend signal AND the RSI Threshold is below 45 AND there's a bullish divergence." All three must align on the same bar. This dramatically reduces false entries compared to trading any single signal alone.
✅ Start With AND-A for All Entry Conditions
When building your first strategy, assign all entry signals to AND-A. You'll get fewer signals, but each represents a genuine multi-factor confluence. Use OR for exits — giving yourself multiple ways out of a trade helps protect profit and limit losses when conditions change.
The following fields appear under every signal module and work the same throughout the tool:
| Field | What It Does |
|---|---|
| Bars [X] is Valid | How many bars after the signal fires it stays valid. 0 = same bar only. 3 = entry window of 3 bars after signal. |
| Post Entry Bars | Bars to wait after entry before re-entering. -1 = no restriction. |
| Profit Filter | Filters entries by current P&L. ANY = no filter. PROFIT = only when profitable. LOSS = only when at a loss. |
| Entry Logical Group | Which AND/OR group this signal contributes to for entries. |
| Exit Logical Group | Which AND/OR group this signal contributes to for exits. |
Signal Module: Krown Cross
The top of the Inputs panel — Strategy Direction, Krown Cross, Patterns, and Divergence all visible here
🔀 Krown Cross Trend Following
The Krown Cross detects trend direction changes using Krown's proprietary EMA cross system — typically the 8, 13, and 21 EMAs crossing above or below the 55 EMA. When the shorter EMAs cross above the 55, an uptrend signal fires. When they cross below, a downtrend signal fires.
Enter on Up Trend — enables a long entry condition when the EMA cross signals bullish momentum. Tick the accompanying Exit checkbox to also use the opposite cross as an exit signal.
Enter on Down Trend — the same logic applied for short entries.
Bars KC is Valid (default 0) — how long the cross signal remains valid after it fires. Setting this to 2–5 gives a small window to catch the move without entering too late into a fast-moving candle.
The Krown Cross works best as a primary trend filter. By assigning it to AND-A alongside your other signals, you ensure entries only fire when the EMA structure is already aligned in your direction — preventing counter-trend trades on short-term noise.
Signal Module: Patterns
📐 Patterns Price Structure
The Patterns module detects Higher Low and Lower High formations — the fundamental building blocks of market structure. A Higher Low means buyers are stepping in at progressively higher levels, a bullish structural signal. A Lower High means sellers are capping price at lower levels each time, a bearish signal.
These aren't lagging calculations — they're direct reads of supply and demand at recent pivot points. Entering a long on a Higher Low means buying at a structurally significant level where the market just demonstrated active buyers exist. That's a high-probability context for continuation.
Signal Module: Divergence
🔄 Divergence Oscillator-Based
Divergence occurs when price and an oscillator disagree — one making new extremes while the other fails to confirm. The module detects four types using any oscillator source you connect:
Bullish Divergence — price makes a lower low but the oscillator makes a higher low. Momentum is improving even as price falls. Often a lead indicator of reversal in oversold conditions.
Hidden Bullish Divergence — price makes a higher low but the oscillator makes a lower low. A trend continuation signal during an uptrend pullback. The price structure is healthy even though the oscillator looks weak — exactly where you want to enter longs.
Bearish Divergence — price makes a higher high but the oscillator makes a lower high. Momentum is fading at new price highs — a warning the move is weakening. Useful as an exit or short entry signal.
Hidden Bearish Divergence — trend continuation signal in a downtrend. Price makes a lower high while the oscillator makes a higher high. Used for short re-entries.
The Oscillator source and Timeframe dropdowns let you pull divergence from any indicator on a higher timeframe, filtering out noise from the chart you're actively trading.
✅ Hidden Bullish Divergence + Krown Cross = Quality Long Entries
One of the most effective KQSKX combinations: assign Hidden Bullish Divergence and the Krown Cross uptrend signal both to AND-A. You're now only entering longs when the EMA trend is bullish AND the oscillator shows continuation strength on a pullback — two independent confirmations on the same bar.
Signal Module: Thresholds A–E
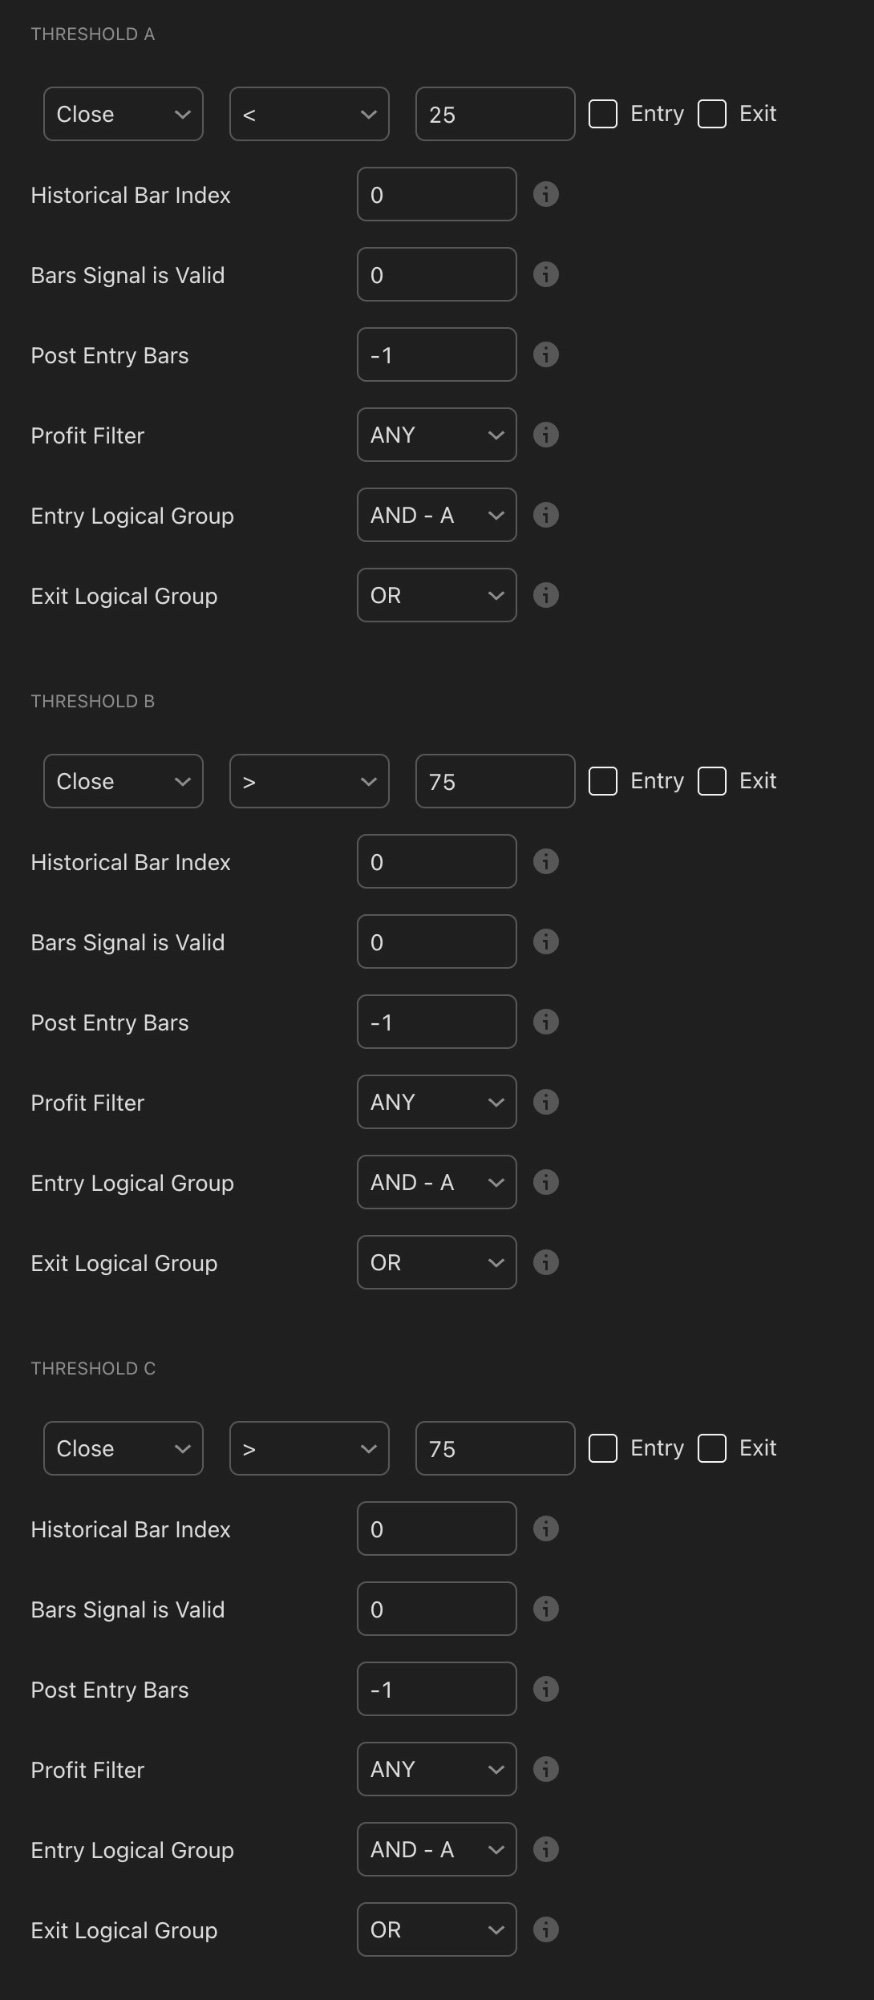
Thresholds A, B, and C shown here — the tool extends to five independent threshold slots (A through E), each with fully customisable source and comparison values
📊 Thresholds A–E Value Conditions
Thresholds define specific value conditions for any indicator source. The defaults show Close < 25 for Threshold A and Close > 75 for B and C — these are templates. Replace "Close" with any oscillator on your chart and the condition becomes meaningful.
Practical examples: set Threshold A to RSI < 40 so entries only fire when RSI is in oversold territory. Or use RSI > 50 as a bullish momentum filter, ensuring you only enter longs when RSI is in the upper half of its range.
Historical Bar Index references the oscillator's value N bars ago — confirming a condition was true recently rather than flickering momentarily. Setting this to 1 or 2 adds confirmation without significant delay.
Having five independent slots means you can layer conditions from multiple different indicators simultaneously. Threshold A could check RSI, B could check your trend oscillator, C could check momentum, D could check volume, and E could check a custom signal — all in AND-A for a very tight entry filter.
Signal Module: Ranges A–E
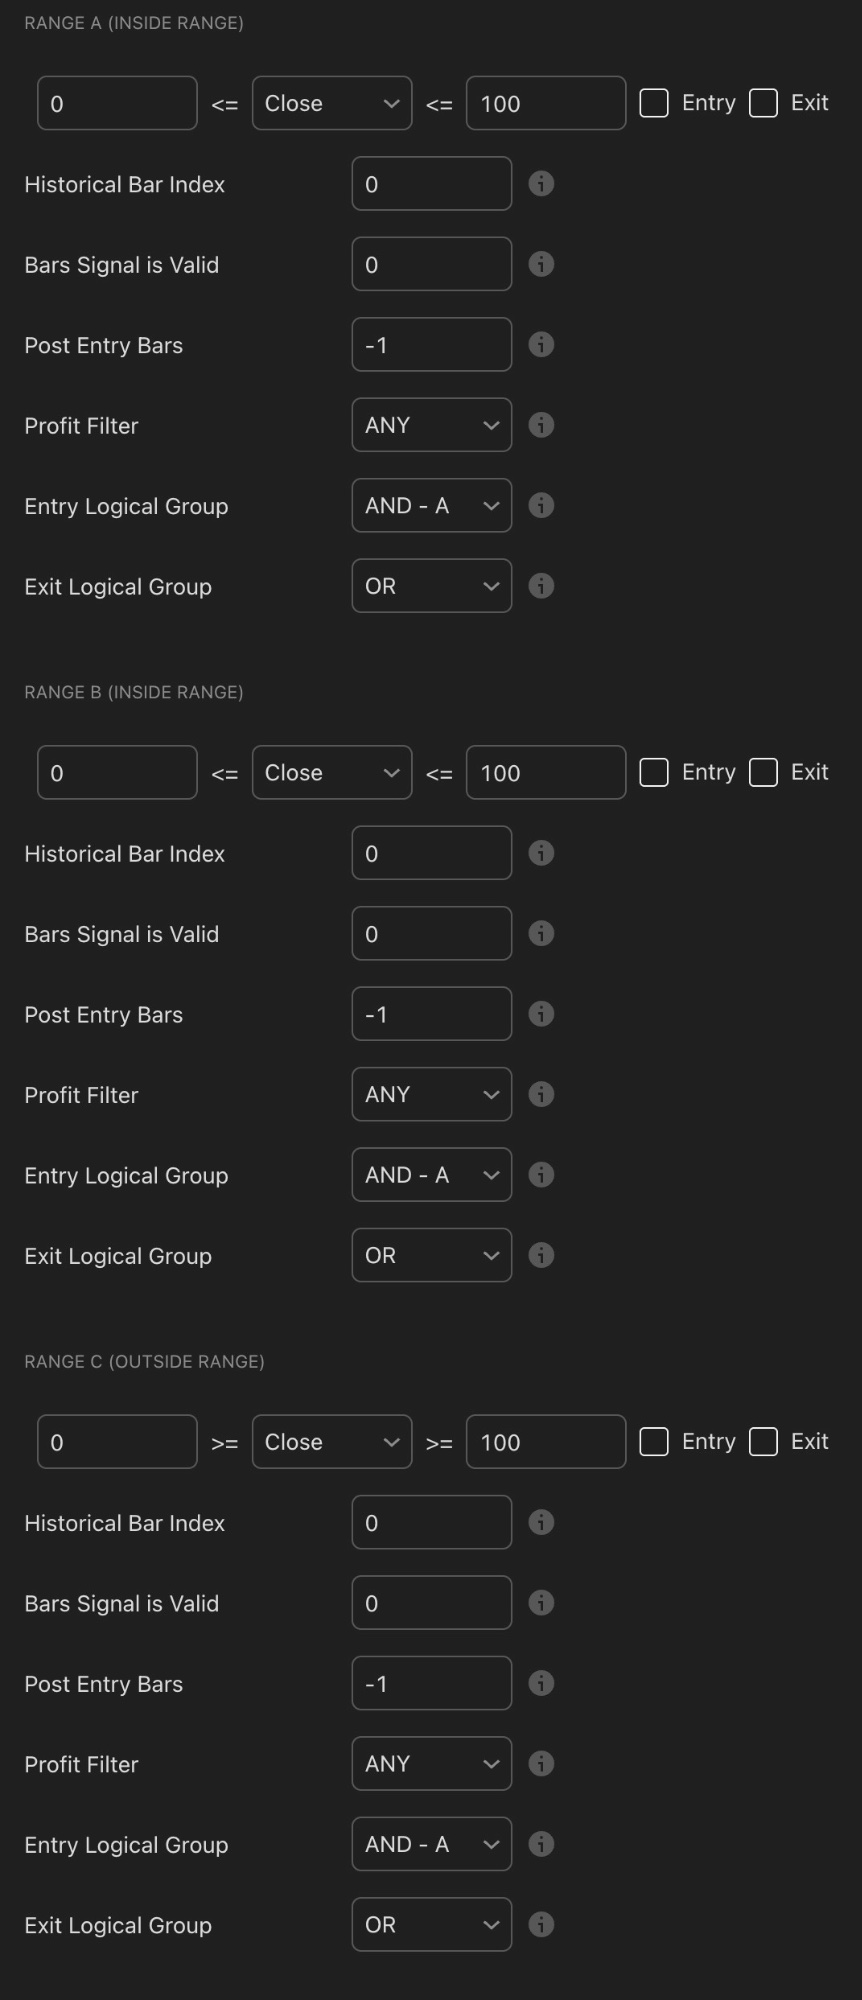
Ranges A–E — Inside Range (A through D) requires a value to fall between two numbers. Outside Range (E) triggers when the value falls outside the band. Five slots total.
↔️ Ranges A–E Value Band Conditions
Ranges check whether an indicator falls within or outside a defined band of values. Ranges A through D are Inside Range — the value must sit between the two numbers you specify. Range E is Outside Range — triggers when the value falls outside that band.
A practical example: use Range A to require RSI is between 30 and 60 before entering — only buying when RSI is in a neutral-to-slightly-oversold zone, never when it's already stretched at 75+. This prevents chasing extended moves and entering at dangerous extremes.
The Outside Range condition (Range E) is useful as an exclusion filter — for instance, do not enter if volatility (ATR) is outside the normal range, blocking entries during unusually chaotic market conditions when stop placement becomes unreliable.
Signal Module: Slopes A–D
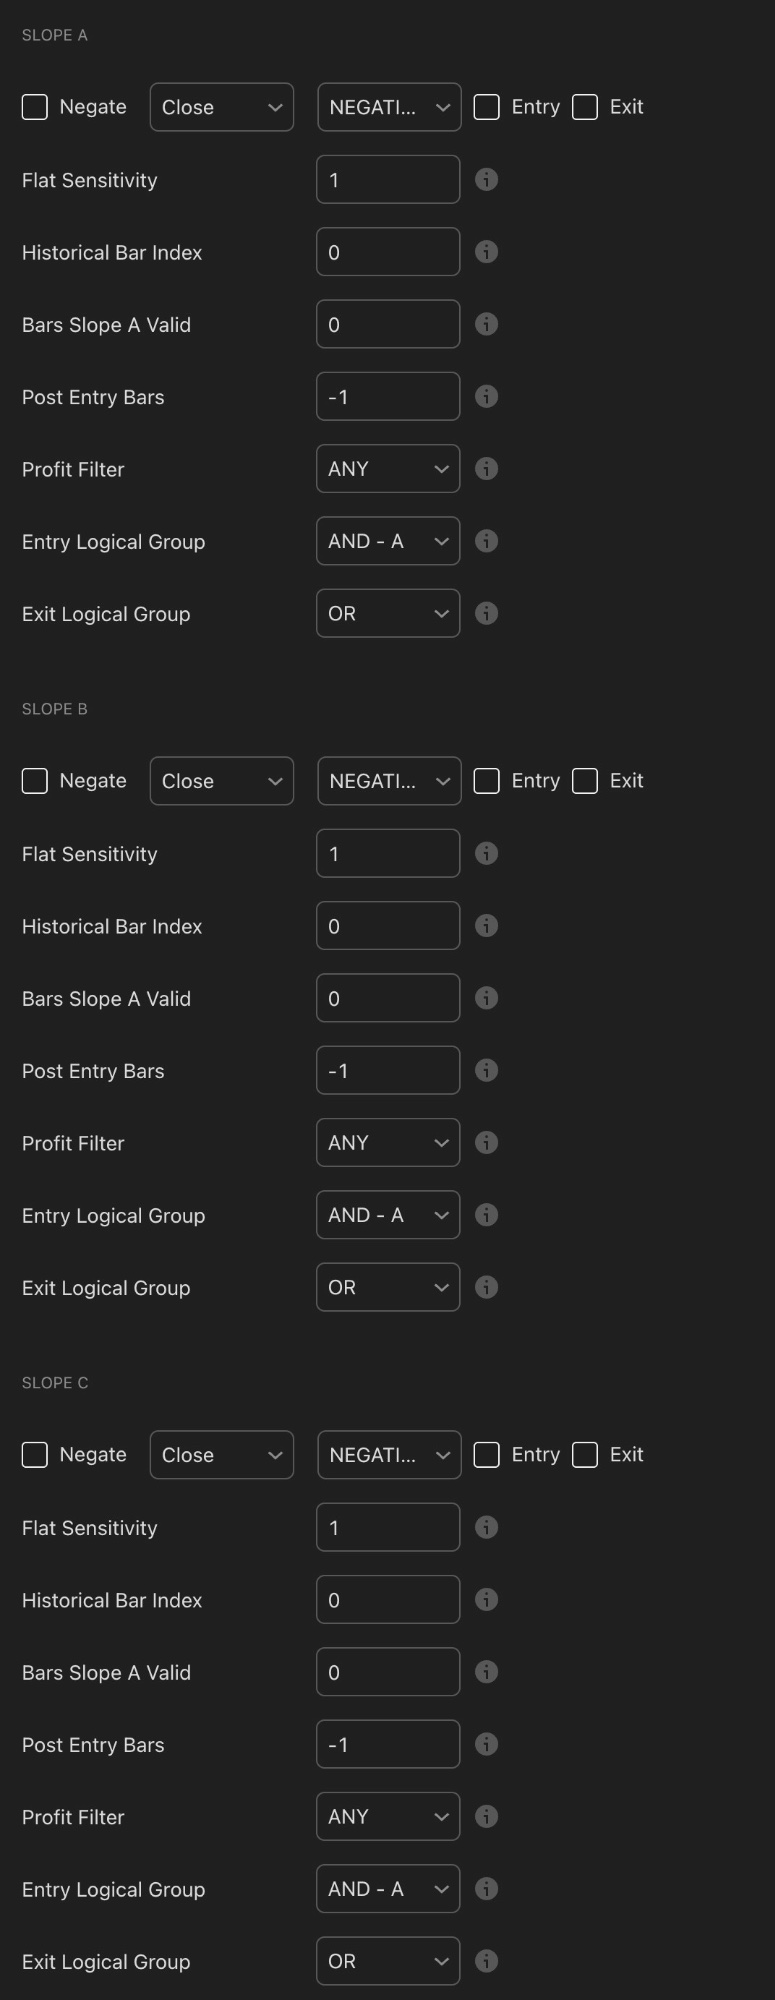
Slopes A–D detect whether any indicator source is rising, falling, or flat. Four independent direction-confirmation slots.
📈 Slopes A–D Direction Conditions
Slopes detect whether an indicator source is pointing up (POSITIVE), pointing down (NEGATIVE), or flat. Four independent slots let you confirm direction on multiple indicators simultaneously.
The most common use: set Slope A to require your trend moving average is POSITIVE (pointing upward) before entering a long. This ensures you never buy into a declining trend even if a short-term signal fires elsewhere.
Negate inverts the condition — useful when you want "not negative" rather than strictly "positive," which avoids excluding the flat zone unnecessarily.
Flat Sensitivity (default 1) controls how steep a slope must be before it's considered directional. Higher values require more pronounced movement before registering as POSITIVE or NEGATIVE.
Historical Bar Index checks the slope from N bars ago — confirming a direction was established recently rather than just flickering on the current bar. Useful to avoid entering on fresh unconfirmed slope shifts.
Signal Module: External Sources A–F
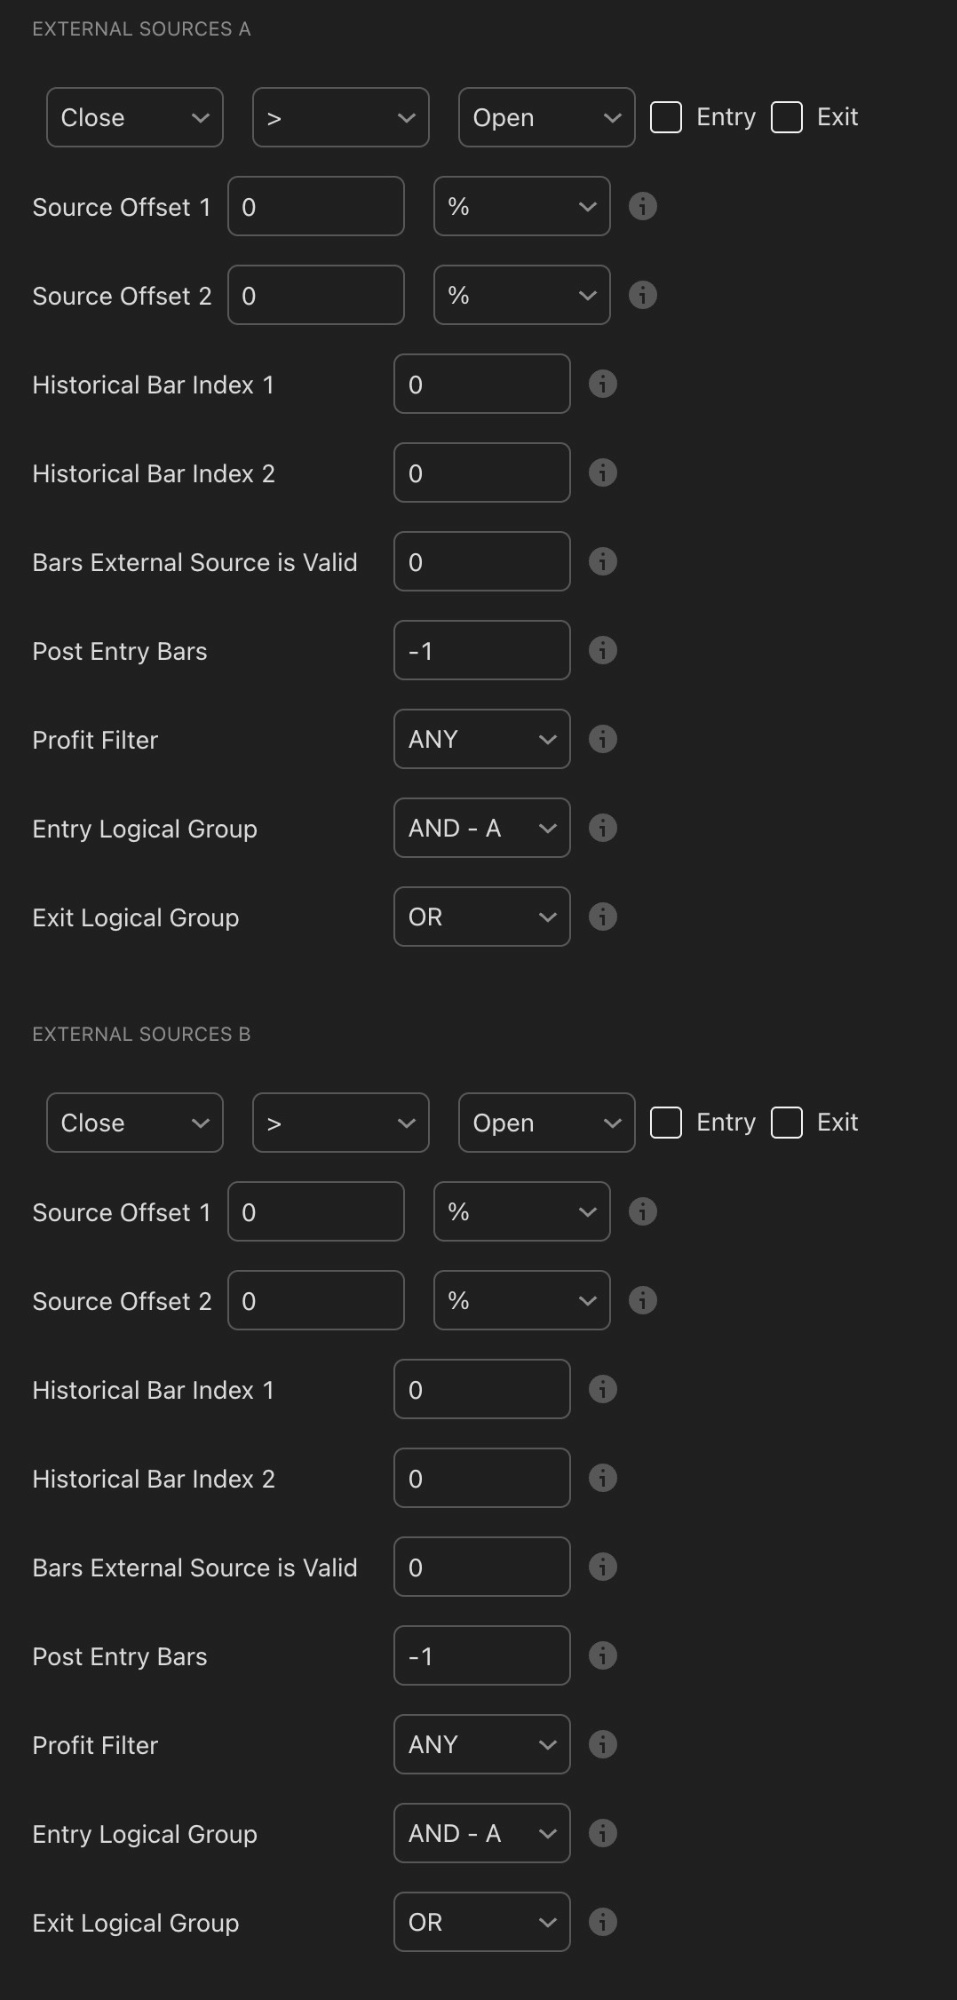
External Sources A and B shown here — the tool extends to six independent cross-source comparison slots (A through F)
🔗 External Sources A–F Cross-Source Comparison
External Sources compare two different indicator values against each other, rather than a single value against a fixed number. The default shows Close > Open — a basic bullish candle check — but any two indicator outputs can be compared. With six independent slots (A through F), this module gives you the most flexibility in the entire tool.
Practical examples: Fast MA > Slow MA confirms a bullish moving average crossover. MACD Line > Signal Line confirms bullish MACD alignment. RSI > RSI Signal confirms RSI is turning upward. These cross-comparisons capture relationships between indicators that Thresholds and Ranges cannot express.
Source Offset 1 and 2 add a percentage buffer to either side — preventing entries on marginal near-equal values where noise could flip the condition back and forth on consecutive bars.
Historical Bar Index 1 and 2 are especially powerful here. Setting Index 1 to 0 and Index 2 to 1 compares the current bar's value to the previous bar's value — enabling a genuine crossover detection rather than just "currently above." This lets you trigger on "the fast MA just crossed above the slow MA" rather than merely "the fast MA is above the slow MA."

With Thresholds A–E, Ranges A–E, Slopes A–D, and External Sources A–F, KQSKX gives you an enormous number of conditions to combine — the skill is choosing the right few and connecting them with AND-A logic — Image: Pexels
Risk Management: Basic, ER, and ATR Stops
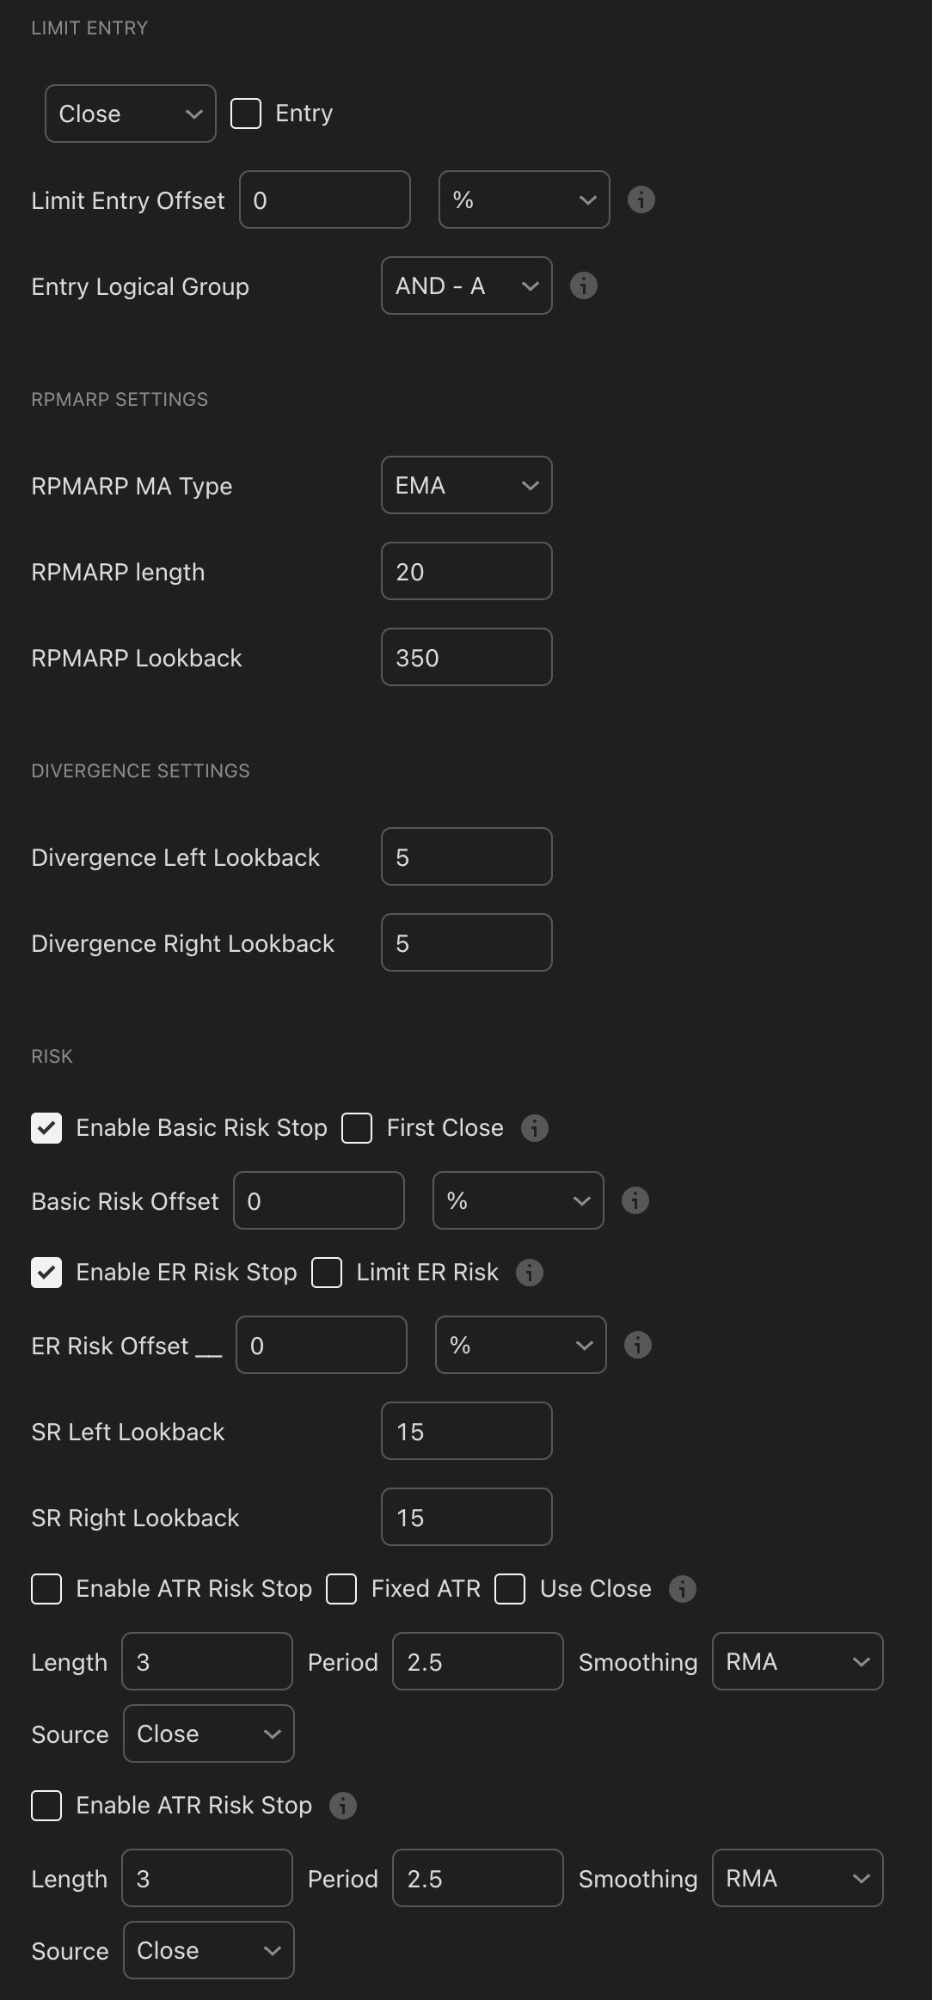
The Risk section — Basic Risk Stop and ER Risk Stop are both enabled in this view. ATR Stop provides a third volatility-adaptive option. RPMARP settings sit above.
The Risk section is often the most important factor in a strategy's long-term viability. KQSKX offers three distinct stop-loss systems. Understanding the difference determines whether your capital survives drawdowns or gets wiped by a single bad trade.
Basic Risk Stop
The simplest stop type. When enabled, it places a stop-loss at a set offset from the entry price. Basic Risk Offset at 0% places the stop at the exact structural level the strategy identifies. Adding a percentage value moves the stop further away for a buffer. First Close changes stop behaviour so the strategy exits on the first candle close beyond the stop level rather than triggering intrabar — preventing false stop-outs from wicks that pierce and recover.
ER Risk Stop (Swing-Based)
The ER (Entry Reference) Risk Stop places the stop at the most recent swing high or low, adapting the distance to actual market structure. SR Left Lookback and SR Right Lookback (both 15 by default) control how many bars the algorithm scans to identify a valid swing point. Higher values identify more significant, further-away swing levels — providing more room but risking more per trade.
💡 ER Stop vs Basic Stop
The ER stop is generally superior because it places risk at a structurally meaningful level — the last swing low. If that level breaks, the trade thesis is invalidated. A fixed % stop is arbitrary by comparison. The tradeoff: ER stops can be wider in choppy markets, which is why pairing KQSKX with the Position Size Calculator is essential — always size your position around the stop distance to keep risk per trade consistent in dollar terms.
ATR Risk Stop
The ATR (Average True Range) stop calculates stop distance dynamically based on recent volatility. In high-volatility conditions, the stop widens automatically. In calm conditions, it tightens. Settings include Length (ATR period, default 3), Period (multiplier, default 2.5), and Smoothing (RMA — smoother response than a standard EMA). A 2.5× ATR multiplier is a widely used professional setting for crypto.
⚠️ Test All Three Stop Types Separately
The same signal combination can have dramatically different performance with Basic, ER, and ATR stops. Run all three configurations before committing to one. The best stop is the one that preserves the most upside while cutting losses decisively — and that answer varies by timeframe and market regime.
Optimization Controls
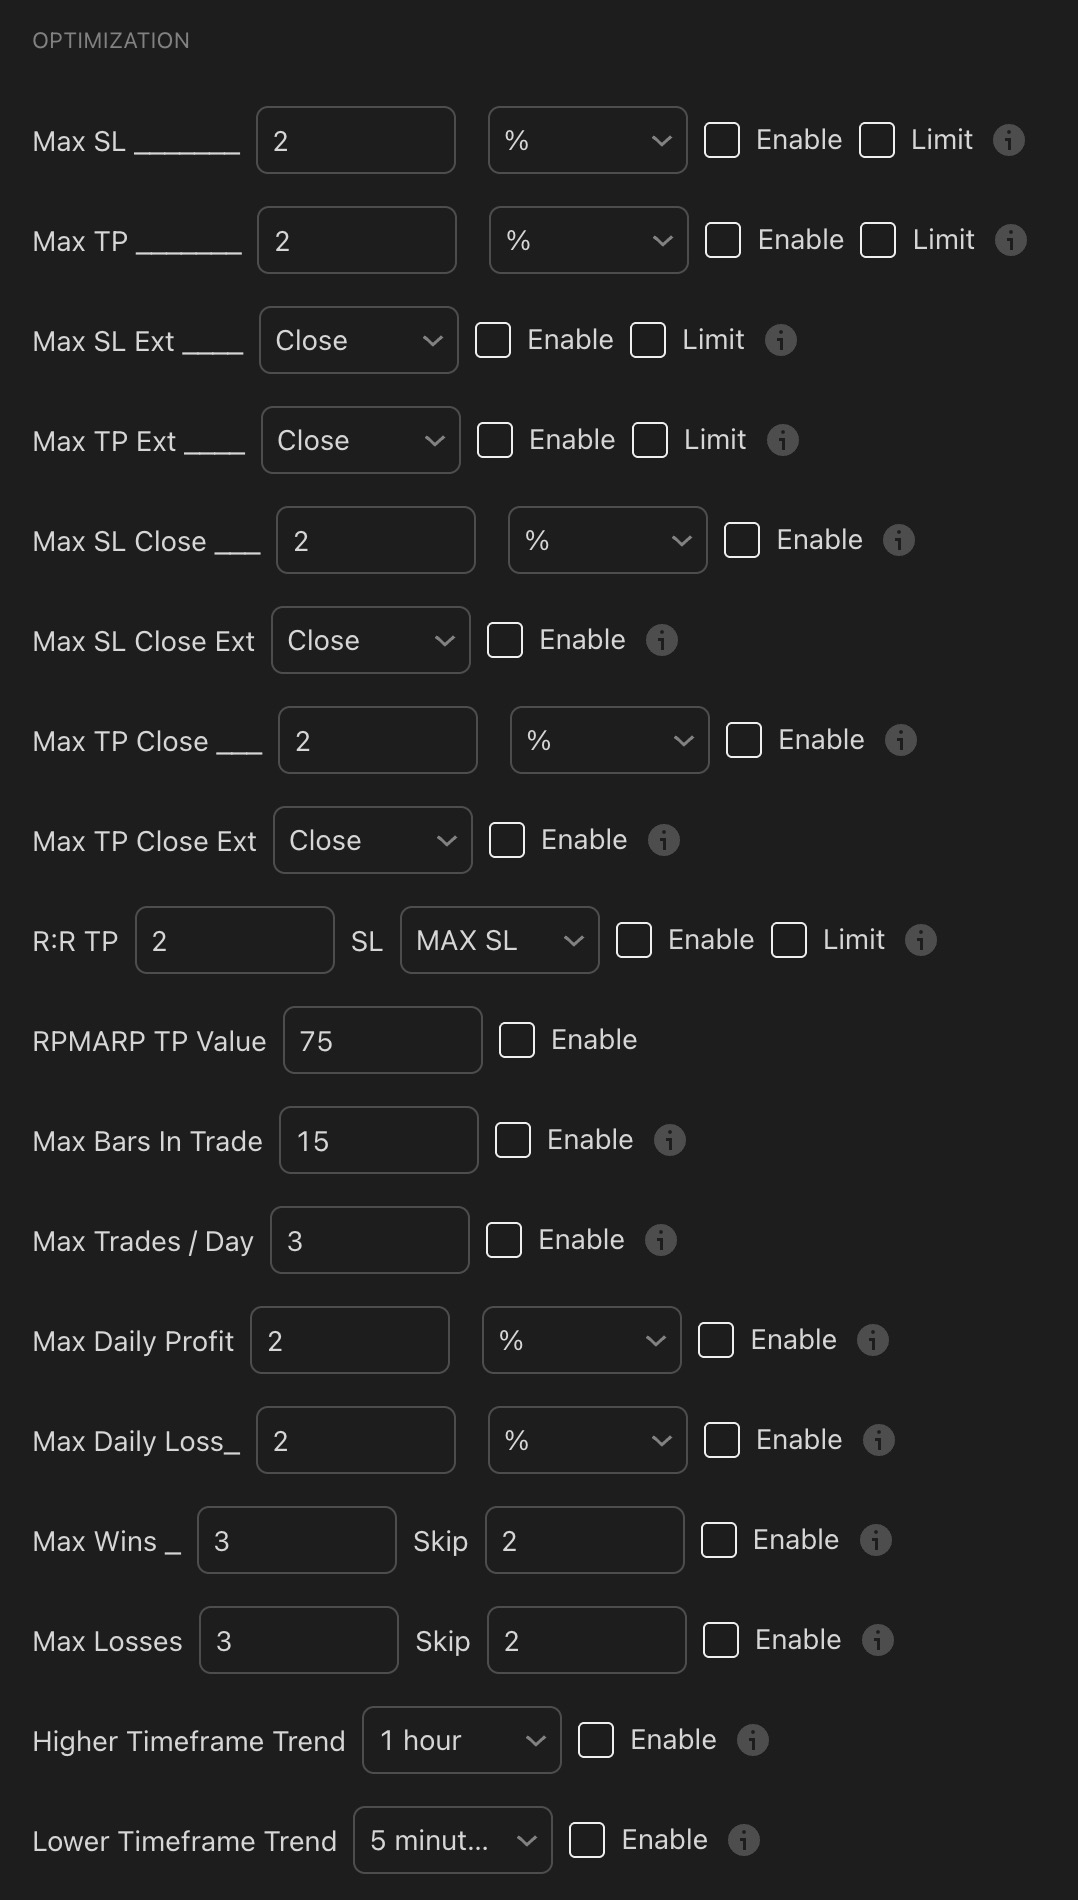
The Optimization section — hard guardrails on strategy behaviour including trade limits, daily caps, the R:R take-profit system, and multi-timeframe trend filters
| Setting | What It Does |
|---|---|
| Max SL / Max TP | Hard percentage cap on stop-loss and take-profit distance. Prevents unrealistically wide targets skewing backtest results. Default 2%. |
| R:R TP | Sets take-profit as a multiple of the stop-loss. R:R 2 with SL = MAX SL places TP at 2× the stop distance — a standard 2:1 risk-reward ratio automatically calculated on every trade. |
| RPMARP TP Value | Uses Krown's RPMARP indicator to exit dynamically when the oscillator reaches a set value (default 75, corresponding to overbought conditions). |
| Max Bars In Trade | Forces an exit after N bars regardless of P&L. Default 15. Prevents trades becoming indefinite holds and keeps capital cycling actively. |
| Max Trades / Day | Caps entries per day. Default 3. Essential overtrading prevention, especially on lower timeframes where signals can fire rapidly. |
| Max Daily Profit / Loss | Stops trading for the day once a profit or loss threshold is hit. Protects against runaway loss days that automated strategies can otherwise accumulate unchecked. |
| Max Wins / Losses + Skip | After N consecutive wins or losses, skips the next N entries. Useful for avoiding the strategy overtrading during unusual market streaks. |
| Higher / Lower Timeframe Trend | Only enters when a higher or lower timeframe is trending in your direction. A powerful multi-timeframe filter without building a separate strategy. |
✅ The R:R TP Setting Is Underused by Beginners
Most beginners focus entirely on signal quality and ignore risk-reward. With R:R TP set to 2, you only need to win 34% of your trades to break even before fees. At a 50% win rate, you're significantly profitable over time. Use the Position Size Calculator alongside your backtest to see exactly how different R:R ratios compound across a full trade history.
Break-Even, Entry Cool Down, and Pyramiding
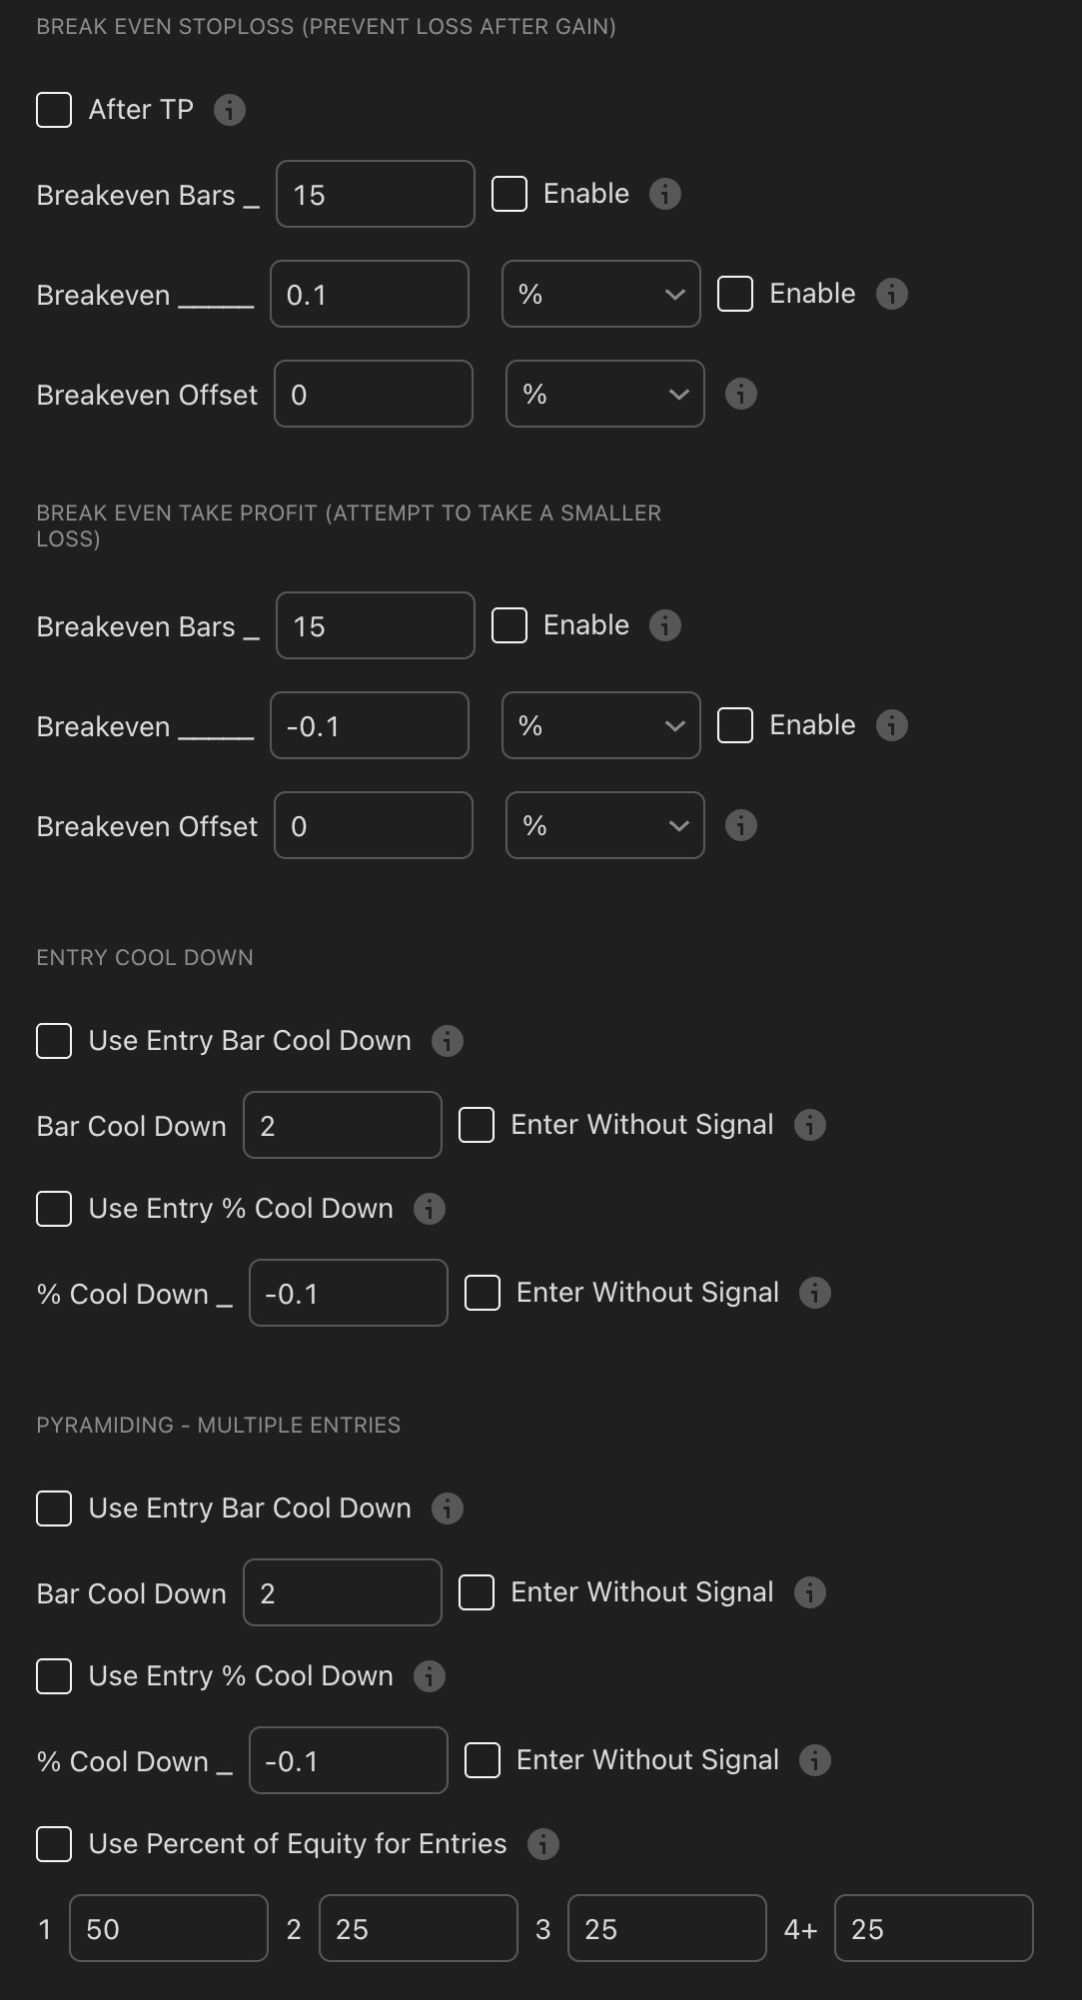
Break-Even Stop Loss, Break-Even Take Profit, Entry Cool Down, and Pyramiding — four systems that protect capital and manage re-entries after exits
Break-Even Stop Loss
Moves your stop to entry price once a trade reaches a specified profit level — eliminating the possibility of a winning trade turning into a loss. After TP triggers the move after your first take-profit is hit. Breakeven Bars (default 15) moves the stop regardless of profit after this many bars in a trade. Breakeven % (0.1%) is the minimum profit required before the stop moves — the buffer covers fees. Breakeven Offset adds further cushion to ensure a clean exit covers commissions entirely.
Break-Even Take Profit (Limit a Smaller Loss)
The reverse concept — if a trade is still in drawdown after a certain number of bars, it exits at a small manageable loss rather than waiting for the full stop. A Breakeven value of -0.1% means "if I'm still down 0.1% after 15 bars, exit now." This prevents stagnant trades from tying up capital indefinitely and eventually hitting a larger stop.
Entry Cool Down
Bar Cool Down (default 2) blocks re-entry for 2 bars after any exit. % Cool Down of -0.1% additionally waits until price has pulled back 0.1% from the exit price — preventing rapid re-entries into the same failed move. Enter Without Signal allows re-entry at the cool-down level even without a fresh signal, useful for DCA-style scaling.
Pyramiding (Multiple Entries)
Pyramiding scales into winning positions with additional entries as the trade develops. The default allocation (Entry 1: 50%, Entry 2: 25%, Entry 3: 25%, Entry 4+: 25%) ensures your initial entry is always your largest commitment — reducing the risk of heavily scaling into a move that subsequently reverses.
Multiple Exits, Date/Time Filters, and Alerts
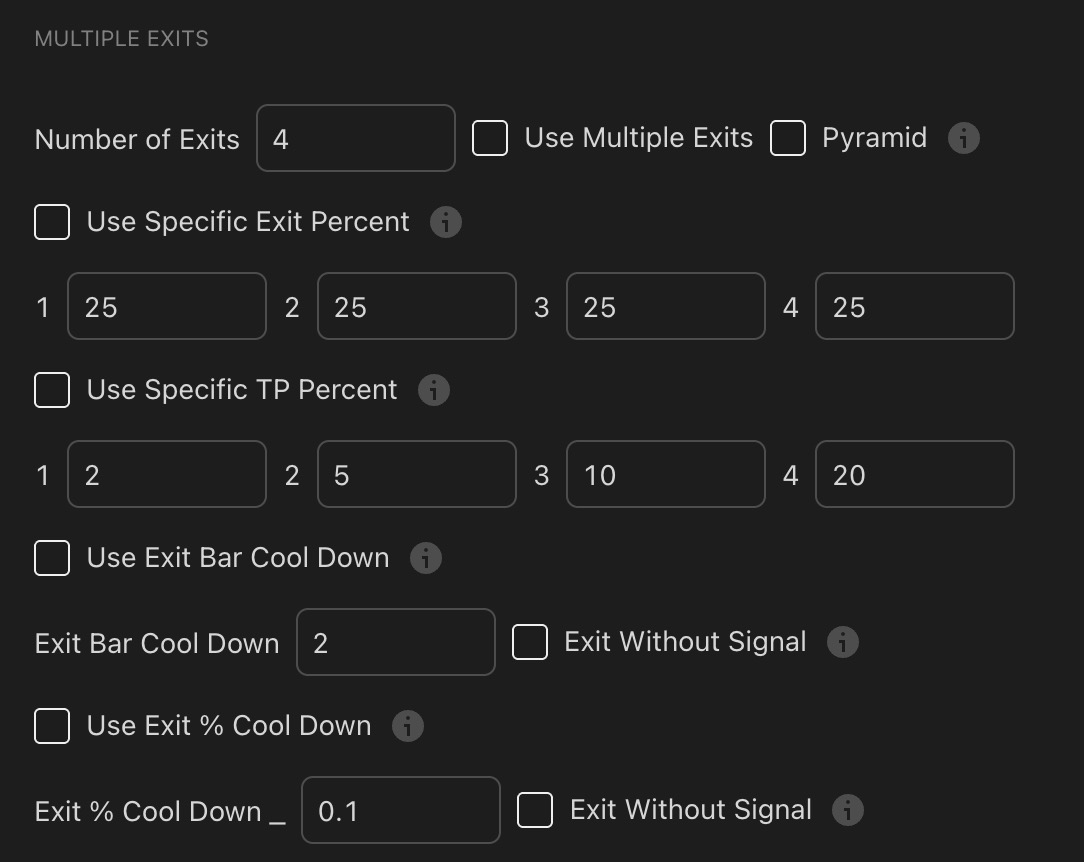
Multiple Exits — scale out in up to four stages, banking partial profit at progressively higher targets while leaving a portion to run
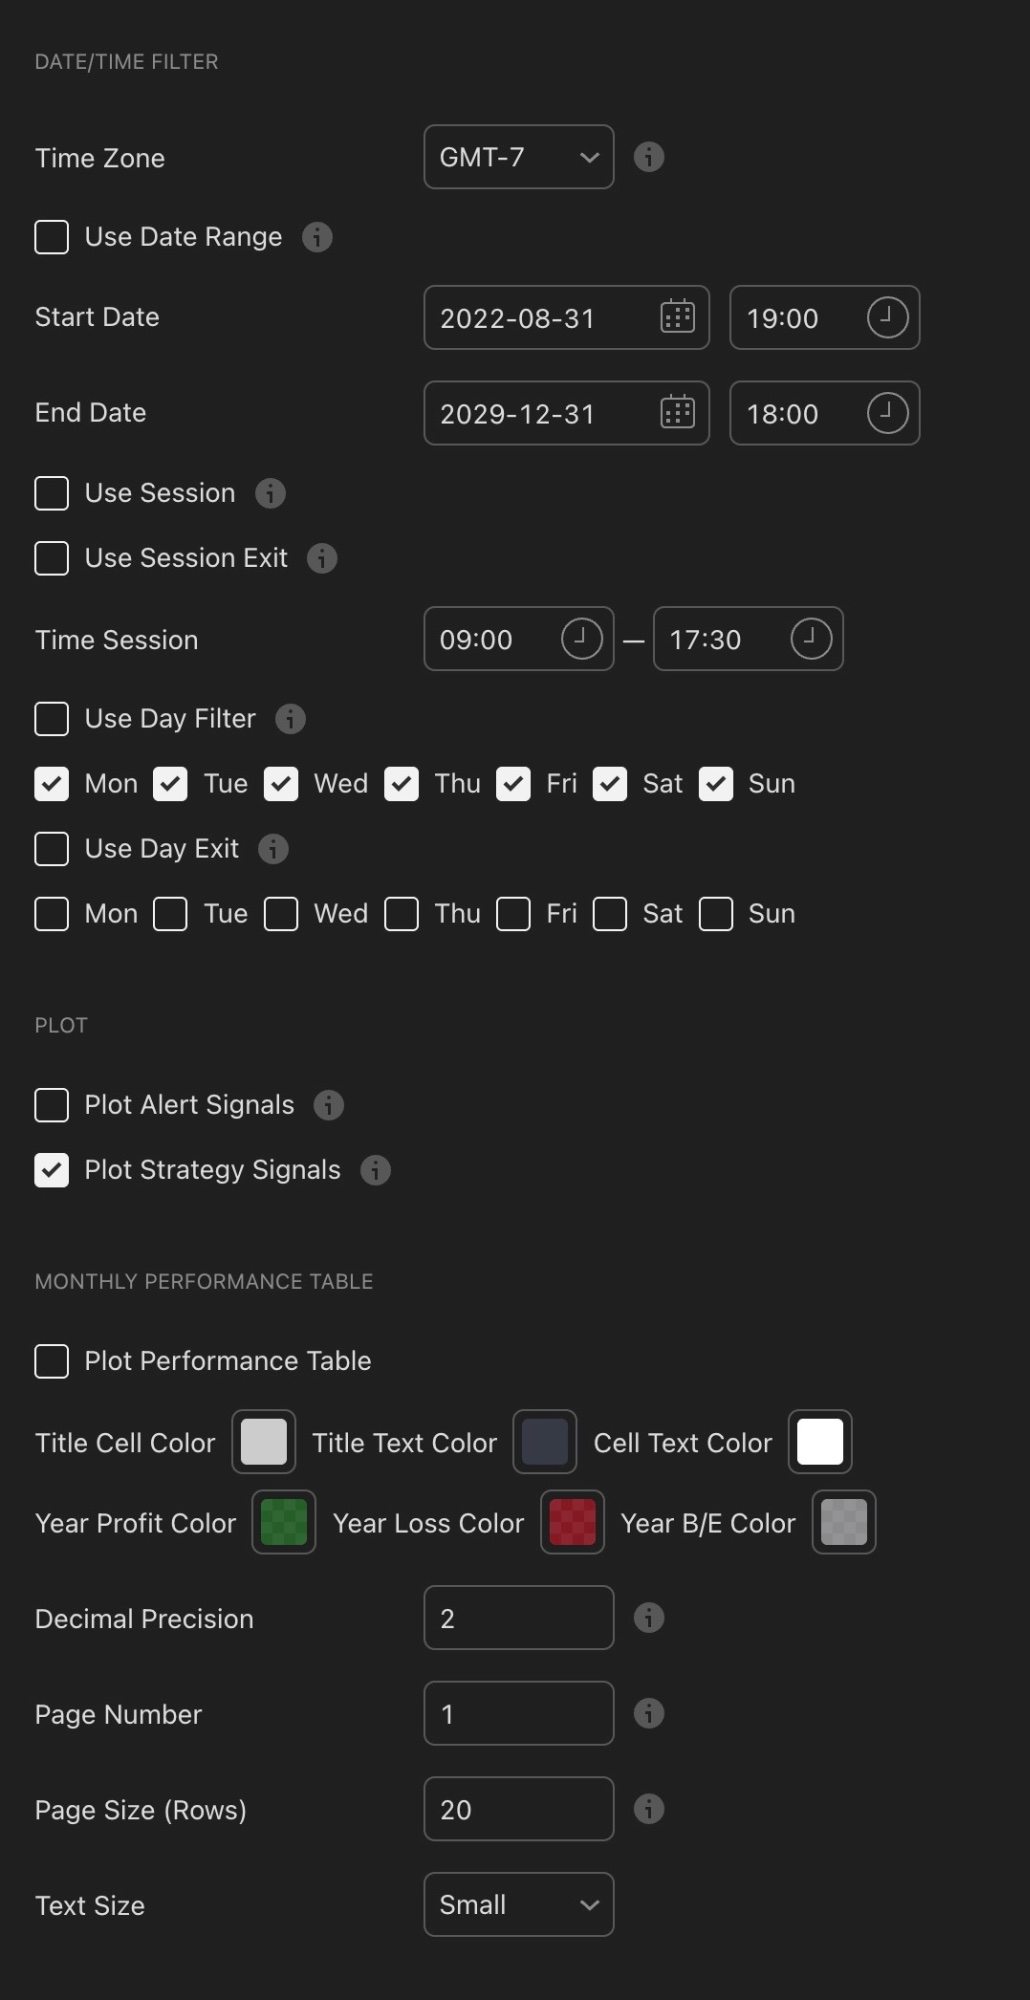
Date/Time Filter and Plot settings — restrict trading hours, session windows, and days of the week, and enable the monthly performance table for detailed results analysis
Multiple Exits
Instead of exiting your entire position at one target, Multiple Exits scales out in stages — locking in profit at different levels while leaving part of the trade running. With 4 exits each taking 25% of the position at targets of 2%, 5%, 10%, and 20%, you bank early gains that reduce anxiety while leaving the final 25% free to ride toward a larger move without risking already-secured profit. This is one of the most psychologically and mathematically sound exit structures available.
Date/Time Filter
The Session filter limits entries to specific hours — useful for avoiding thin, low-liquidity periods. The Day Filter restricts which days of the week the strategy runs. For 24/7 crypto markets, you might exclude sessions around major macro announcements that create unpredictable volatility. The Date Range toggle is also valuable for isolating a backtest to a specific market regime — running your strategy only during the 2022 bear market or only the 2024 bull run reveals how robust the settings actually are under different conditions.
⚠️ Don't Use Time Filters to Game Your Backtest
If removing a specific session window dramatically improves backtest numbers, that's curve-fitting to historical data — not a genuine edge. Only use time filters when you have a fundamental reason for excluding that period.
Alerts
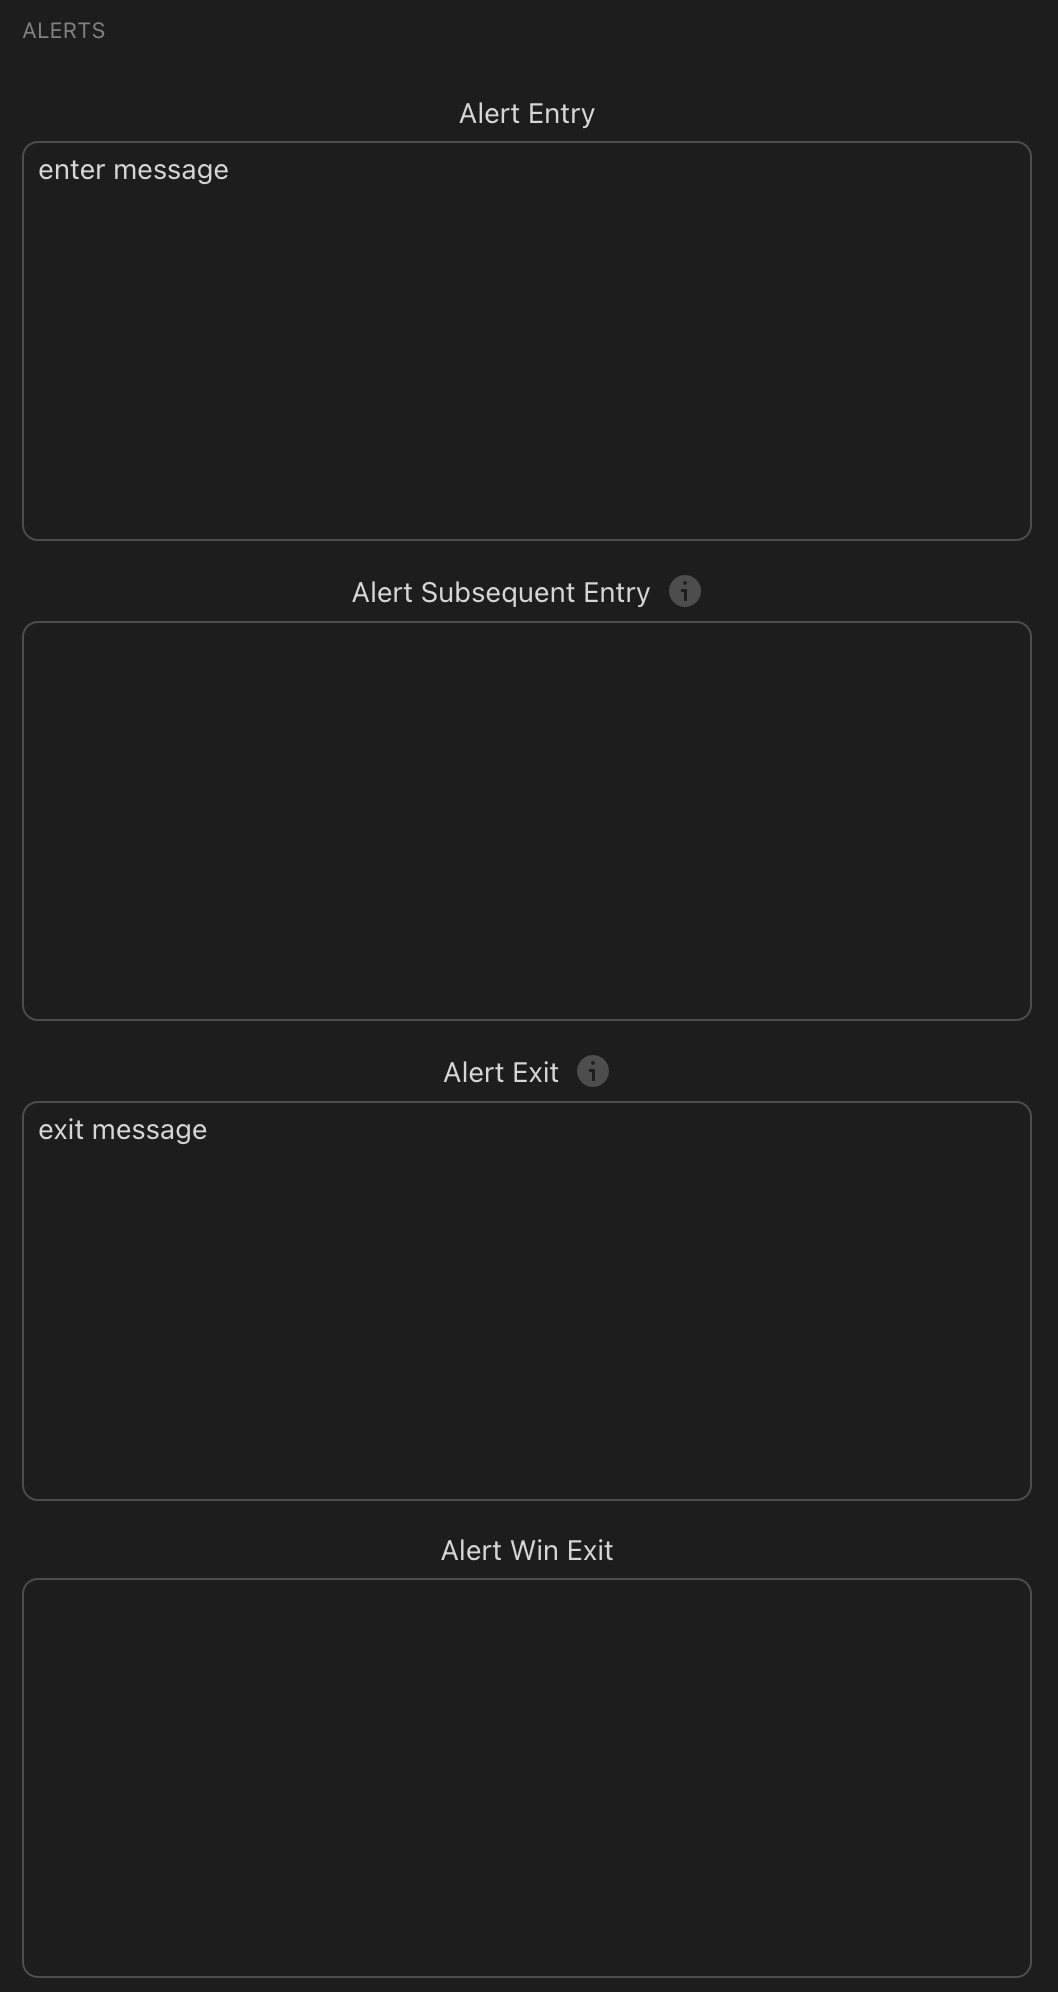
The Alerts section — configure entry, subsequent entry, exit, and win-exit message payloads for automated bot execution via Alertatron or similar services
The Alerts section is what turns your backtested strategy into a live automated system. Configure the Alert Entry message with the JSON payload your bot service (such as Alertatron) expects, and TradingView fires that alert to your bot whenever an entry condition triggers. The same applies for exits. Alert Subsequent Entry handles pyramiding alerts, and Alert Win Exit fires specifically when a trade closes profitably — allowing you to log or act on winning trades separately from stopped-out ones.
Properties Tab: Getting Your Backtest Right
The Properties tab sets the simulation environment. An unrealistic setup produces misleading performance data that looks impressive on screen and fails in live trading.
| Setting | Recommended Value | Why |
|---|---|---|
| Initial Capital | $10,000 | Standard reference. Makes percentages easy to interpret and compare across different strategy versions. |
| Default Order Size | 10% of Equity | Change from "1 Quantity" to "% of Equity." 10% per trade simulates proper position sizing rather than a fixed quantity that becomes increasingly large as equity grows. |
| Commission | 0.06% | Matches Binance/Bybit taker fee. Never backtest at 0% — fees destroy more strategies than bad signals. |
| Slippage | 1–2 ticks | Accounts for real-world execution gaps. 0 ticks is unrealistic on any live market. |
| Pyramiding | Match your Inputs setting | If pyramiding is enabled in Inputs, set this to 3 or 4 to allow multiple simultaneous positions to simulate correctly. |
| Fill Orders: On Bar Close | Consider enabling | Fills at bar close rather than intrabar — more realistic for swing strategies on 4H timeframes and above. |
💡 Commission Settings Change Everything
A strategy showing 200% annual return at 0% commission might return only 80% at 0.06% — especially on lower timeframes. On a 15-minute chart with 500+ trades per year, fees alone can account for 30–60% of gross profit. Always backtest with realistic fees, and if a strategy is only profitable without them, it has no real edge worth trading live.
Your First Simple Strategy
Now that you understand every component, here's a clean beginner setup to try on Bitcoin's 4-hour chart. Two conditions in AND-A — simple, conservative, and easy to understand. This demonstrates how the modules work together without overwhelming you with variables to tune simultaneously.

Start with the 4H BTC chart — enough historical data for a meaningful multi-year backtest while keeping signal frequency manageable — Image: Pexels
🎯 Beginner Long-Only BTC 4H Starter Strategy
📐 Calculate Your Risk Before Every Trade
Once KQSKX identifies your stop-loss level, use the Trade Logic Position Size Calculator to determine exactly how much to allocate — keeping every loss within your predetermined risk limit regardless of how wide or narrow the stop is placed.
Open Position Size Calculator →Frequently Asked Questions About KQSKX
These are the questions traders most commonly ask when first encountering the KQSKX strategy builder.
What is the KQSKX and who created it?
The KQSKX — also called the Skeleton Key X — is a professional-grade TradingView strategy script created by Krown of Krown's Crypto Cave, one of the most well-known technical analysts in the crypto space. It's the centrepiece of Krown's Quant Automation subscription service.
What makes it unique is that it lets you build, backtest, and automate multi-condition trading strategies entirely through a settings interface — no Pine Script coding required. You configure entry and exit conditions using pre-built signal modules, combine them using AND/OR logic, test against real historical price data, and then connect the results to a trading bot for automated execution.
Is the KQSKX free to use?
No, the KQSKX requires a paid subscription through Krown's platform. The subscription includes the KQSKX strategy script, Krown's proprietary indicator suite (Krown VMP, Stochastics, Fibonacci), access to a private Discord community with 150+ shared strategy templates, and support documentation for connecting to automated bot execution services like Alertatron.
Alertatron itself offers a free plan that allows up to 5 trade signals per day, which is enough for most swing trading strategies on higher timeframes.
What is the most important concept to understand in KQSKX?
The Logical Groups system is the single most important concept. It controls how your signal conditions interact with each other to produce entries and exits. Without understanding this, the rest of the tool makes little sense.
In short: signals assigned to AND-A must all be true simultaneously for an entry to trigger. Signals assigned to OR fire independently. This means you can create a strategy that requires a trend signal AND a divergence signal AND an oscillator condition to all align at the same moment — dramatically filtering out lower-quality entries compared to any single signal used alone. Most experienced KQSKX users put all entry conditions into AND-A and use OR for exits, giving many opportunities to exit but very strict criteria to enter.
How many conditions can I combine in one KQSKX strategy?
There's no hard limit. You have seven signal module types — Krown Cross, Patterns, Divergence, Thresholds (A–E, so five slots), Ranges (A–E, five slots), Slopes (A–D, four slots), and External Sources (A–F, six slots). In theory you could stack over 20 separate conditions into a single AND-A group.
In practice, however, more conditions doesn't mean a better strategy. Adding too many filters causes "over-fitting" — your strategy performs beautifully on historical data by being so specific it almost never fires, but fails to generalise to future market conditions. The sweet spot for most successful strategies is 2–4 AND-A conditions that each address a different aspect of the market (trend, momentum, structure, volatility). Quality beats quantity every time.
What is the difference between the Basic, ER, and ATR risk stops?
The three stop types place your stop-loss in fundamentally different ways. The Basic Risk Stop uses a fixed percentage offset from your entry — simple, predictable, but arbitrary in relation to market structure. The ER (Entry Reference) Risk Stop places the stop at the most recent swing high or low — a structurally meaningful level where the trade thesis is genuinely invalidated if breached. This is generally the most recommended option because it aligns your risk with actual market behaviour rather than a predetermined number. The ATR Risk Stop uses Average True Range to calculate stop distance — automatically widening in volatile conditions and tightening in calm ones. ATR stops are excellent in trending markets where volatility is consistent but can be problematic around major events where ATR spikes temporarily.
You can enable multiple stop types simultaneously, in which case the closest stop to entry wins. Most professional KQSKX users run ER as the primary stop with ATR as a secondary backup.
What timeframe works best for KQSKX strategies?
This depends entirely on your trading style and how much time you want to spend managing positions. Higher timeframes (4H, Daily) produce fewer but higher-quality signals with less noise, require less monitoring, and have more statistical significance per signal. Lower timeframes (15m, 1H) produce more signals — which gives the backtest more data points to draw from, but also means the strategy is more sensitive to fees and requires more active oversight.
For beginners using KQSKX, the 4-hour chart on Bitcoin is the most commonly recommended starting point. It produces enough signals to give meaningful backtest data, the fees per trade are manageable relative to the move size, and it doesn't require watching the screen constantly. Once you're confident in the tool mechanics, you can explore other timeframes and assets.
How do I know if my KQSKX backtest results are reliable?
A reliable backtest has several hallmarks. It covers at least 2 years of data and includes both bull and bear market conditions — a strategy that only works in one market phase isn't robust. It has been run with realistic commission (0.06%) and slippage (1–2 ticks) — removing these can make almost any strategy look profitable. It shows a profit factor above 1.5 (meaning for every $1 lost, you make $1.50+), a win rate you could realistically sustain (50–65% is healthy; 90%+ is almost certainly over-fitted), and a maximum drawdown below 25%.
Beyond the numbers, the best reliability check is running the same settings on a different but related asset (e.g., building on BTC then testing on ETH without changes). If performance holds, the edge is likely genuine. If it collapses, the strategy was curve-fitted to Bitcoin's specific historical price action.
Can KQSKX execute trades automatically?
Yes — automated execution is one of KQSKX's primary design goals. The Alerts section of the settings lets you define messages that fire whenever your strategy signals an entry or exit. These alert messages connect to a third-party bot service (Alertatron is the platform Krown's community primarily uses), which then routes the signal to your exchange account and executes the trade automatically.
The process requires setting up an API connection between TradingView, the bot service, and your exchange. Krown's subscription includes documentation and tutorial videos for the full setup process. Once live, your strategy runs 24/7 on TradingView's servers — firing alerts and executing trades even when you're sleeping or away from the screen. Always use a dedicated API key with trading-only permissions (never withdrawal permissions) and start with small position sizes until you've observed the bot performing correctly in live conditions.
What's the difference between divergence and hidden divergence?
Regular divergence is a reversal signal — price and the oscillator are moving in opposite directions, suggesting the current trend is losing momentum and may reverse. Bullish divergence occurs when price makes a lower low but the oscillator makes a higher low, indicating selling pressure is weakening despite price falling further. Bearish divergence is the opposite.
Hidden divergence is a continuation signal — it confirms the existing trend is likely to resume after a pullback. Hidden bullish divergence occurs during an uptrend: price makes a higher low (a normal pullback) but the oscillator makes a lower low. This mismatch suggests the pullback is shallow relative to momentum — the underlying trend is still strong and likely to continue upward. For trend-following strategies in KQSKX, hidden bullish divergence is generally more useful than regular bullish divergence because it aligns with rather than fights the existing trend direction.
Quick Glossary: KQSKX Terms Explained
New to the KQSKX? These are the terms that come up constantly when building and discussing strategies in the tool.
- AND-A / AND-B / AND-C
- Logical groups where every assigned signal must be true simultaneously for an entry to fire. The most common entry configuration.
- OR Group
- A logical group where any single assigned signal is sufficient to trigger an entry or exit independently.
- Krown Cross
- Krown's proprietary EMA cross signal — fires when shorter EMAs cross above or below the 55 EMA, indicating trend direction changes.
- Divergence
- When price and an oscillator move in opposite directions. Bullish divergence (price lower low, oscillator higher low) often precedes reversals upward.
- Hidden Divergence
- A trend continuation signal. Hidden bullish = price higher low but oscillator lower low. Signals a pullback within an uptrend likely to resume.
- ER Risk Stop
- Entry Reference stop — places your stop at the most recent swing high or low rather than a fixed percentage, making it structurally meaningful.
- ATR Stop
- Average True Range stop — automatically widens in volatile conditions and tightens in calm ones, adapting to current market behaviour.
- R:R TP
- Risk-Reward Take Profit — sets your profit target as a multiple of your stop distance. R:R of 2 means the TP is twice as far away as the stop.
- RPMARP
- Krown's proprietary oscillator included with the subscription. Used as a dynamic take-profit reference within the Optimization section.
- Bars Valid
- How many bars after a signal fires it remains eligible to contribute to an entry. Prevents stale signals from triggering trades late.
- Post Entry Bars
- Minimum bars to wait after an exit before the strategy can enter again. Prevents immediately re-entering after a stop-out.
- Pyramiding
- Adding to a position with additional entries as the trade develops. KQSKX allocates 50% to the first entry, 25% to subsequent ones by default.