If RSI is the speedometer and MACD is the GPS, then Bollinger Bands are the weather forecast. They don't tell you which way to drive — they tell you whether you're heading into calm conditions or a storm. And in crypto, knowing when a storm is building is often more valuable than knowing which direction it'll blow.
Bollinger Bands are a volatility indicator — and that's a critical distinction. While RSI measures momentum extremes and MACD tracks trend direction, Bollinger Bands measure something entirely different: how stretched or compressed price action is relative to its recent behaviour. This makes them the perfect complement to momentum and trend indicators, filling a gap that neither RSI nor MACD can cover on their own.
Created by John Bollinger in the 1980s, the indicator has become one of the most widely used tools in all of trading. Bollinger himself famously stated that the bands "define high and low on a relative basis" — meaning they automatically adapt to whatever the market is doing. In a volatile market, the bands widen. In a quiet market, they contract. This self-adjusting nature is what makes them so powerful, especially in crypto where volatility can change dramatically from one week to the next.
In this guide, we'll break down every component of Bollinger Bands, explain the five core trading strategies built around them, show you which indicators to pair them with, and give you a practical step-by-step crypto strategy you can start using immediately.
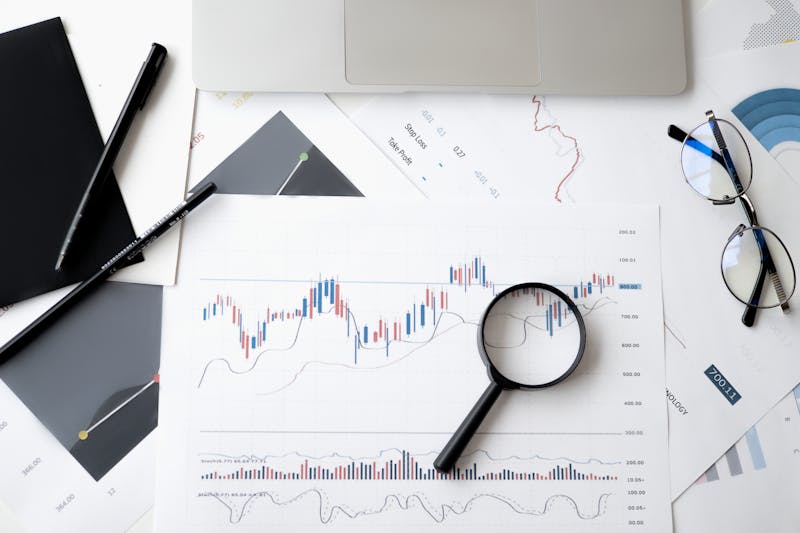
Bollinger Bands adapt to market conditions automatically, making them ideal for crypto's shifting volatility — Image: Pexels
What Are Bollinger Bands?
Bollinger Bands consist of three lines plotted directly on the price chart, creating an envelope or channel that surrounds the price action. Unlike indicators that appear in separate panels below the chart (like RSI or MACD), Bollinger Bands sit right on top of the candles, giving you a real-time visual of how price relates to its recent volatility range.
The Three Bands
1. The Middle Band — This is a simple moving average (SMA), typically set to 20 periods. It represents the "average" price over the lookback period. When price is above the middle band, conditions are generally bullish. When below, they're generally bearish. The middle band also acts as a dynamic support or resistance level — price frequently bounces off it during trends.
2. The Upper Band — This is the middle band plus two standard deviations. It represents the upper boundary of "normal" price action. When price touches or exceeds the upper band, it's statistically stretched to the upside. In a ranging market, this suggests overbought conditions. In a trending market, it signals strong momentum.
3. The Lower Band — This is the middle band minus two standard deviations. It represents the lower boundary of normal price action. When price touches or drops below the lower band, it's statistically stretched to the downside. In a ranging market, this suggests oversold conditions. In a trending market, it signals strong selling pressure.
The 95% Rule: With the default settings (20 periods, 2 standard deviations), approximately 95% of all price action will occur within the bands. This means that when price moves outside the bands, something statistically unusual is happening — and unusual events in trading often create opportunities.
The key insight that separates good Bollinger Band traders from bad ones is understanding that the bands are not fixed. They expand and contract based on recent volatility. Wide bands mean the market has been volatile. Narrow bands mean the market has been quiet. This expansion and contraction cycle is the heartbeat of Bollinger Bands analysis, and it's the foundation for the most powerful strategy: the Bollinger Squeeze.
How Are Bollinger Bands Calculated?
The maths behind Bollinger Bands is more intuitive than it looks. Your charting platform handles the calculations automatically, but understanding the mechanics helps you interpret the bands correctly.
Upper Band = Middle Band + (2 × Standard Deviation)
Lower Band = Middle Band − (2 × Standard Deviation)
Bandwidth = (Upper Band − Lower Band) ÷ Middle Band
Let's walk through a practical example. Say Bitcoin's 20-day SMA is $96,000, and the standard deviation of closing prices over the same period is $3,000.
The upper band would be $96,000 + (2 × $3,000) = $102,000. The lower band would be $96,000 − (2 × $3,000) = $90,000. The total width of the channel is $12,000.
Now imagine volatility drops. The standard deviation falls to $1,500. The upper band moves to $99,000 and the lower band to $93,000. The channel has contracted from $12,000 wide to just $6,000. The bands are squeezing together — and as we'll cover later, this compression often precedes explosive moves.
The standard deviation is the critical ingredient. It measures how spread out prices have been from the average. High standard deviation = prices have been swinging wildly = wide bands. Low standard deviation = prices have been calm = narrow bands. This is what makes Bollinger Bands "adaptive" — they automatically adjust their width based on current market conditions.
The Bandwidth formula (the fourth line above) normalises the band width as a percentage of the middle band. This is useful for comparing volatility across different time periods or assets. A Bandwidth value of 0.05 means the bands are 5% of the average price apart — relatively tight. A value of 0.20 means they're 20% apart — very wide.
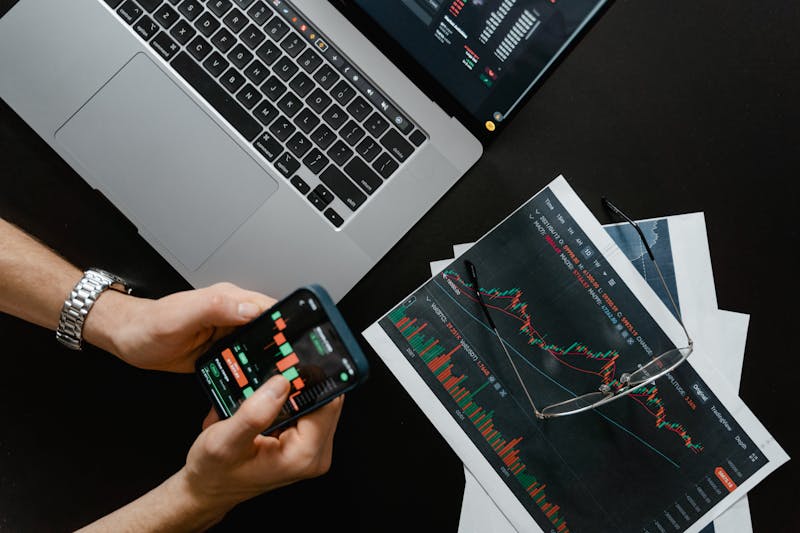
Understanding the calculation helps you interpret what the bands are really telling you — Image: Pexels
Are Bollinger Bands a Leading or Lagging Indicator?
Bollinger Bands occupy an interesting middle ground. The middle band (the 20-period SMA) is unambiguously lagging — it's based entirely on historical prices. But the bands themselves have significant leading qualities because of how they use standard deviation.
The leading quality comes from the squeeze. When Bollinger Bands contract to unusually narrow levels, they're telling you that volatility is compressed and a breakout is coming — before it actually happens. You don't know which direction the breakout will go, but you know the current calm is about to end. This forward-looking quality is rare among technical indicators and is one of the main reasons traders value Bollinger Bands so highly.
The lagging quality comes from the moving average core. Band touches and crossovers of the middle band confirm what has already happened rather than predicting what's next. Price has to move first; the bands react second.
In practice, the best approach is to use the squeeze as a leading signal (something is about to happen) and the band interactions as confirming signals (here's what's happening now). Combine these with a directional indicator like MACD to determine which way the breakout is likely to go, and you have a powerful system.
Are Bollinger Bands Accurate?
The bands themselves are mathematically precise — they always accurately represent the current moving average plus or minus two standard deviations. The question is whether the trading signals derived from them are reliable.
Where Bollinger Bands Excel
Bollinger Bands are excellent at identifying volatility regimes — periods of low volatility that precede big moves, and periods of high volatility that often signal exhaustion. No other common indicator does this as effectively. They also work well for identifying mean reversion opportunities in range-bound markets, where price oscillates predictably between the bands.
In crypto, the squeeze pattern is particularly valuable. Cryptocurrency markets alternate between periods of intense volatility and periods of consolidation. Bollinger Bands visually map these cycles and help you prepare for transitions between them. When Bitcoin compresses into a tight range and the bands narrow significantly, experience tells us an explosive move is imminent.
Where Bollinger Bands Struggle
The biggest trap is treating every upper band touch as "overbought" and every lower band touch as "oversold." In strong trends, price can "walk the band" — riding along the upper or lower band for extended periods without reversing. If Bitcoin is in a strong rally, it can touch or exceed the upper band day after day. Shorting every touch would be catastrophic. Context is everything.
Bollinger Bands also struggle during news-driven, sudden moves. A surprise regulatory announcement or exchange hack can send price slicing through the bands with no respect for statistical norms. The bands measure normal market behaviour — and sometimes the market is anything but normal.
⚠️ The Band Walk Trap: In a strong uptrend, price can ride along the upper band for weeks. Beginners see "price touching upper band" and think "sell." Experienced traders see "price walking the upper band" and think "strong trend — stay long." The difference between these two interpretations can mean the difference between profit and loss. Always check the trend direction before reacting to a band touch.
Bollinger Band Settings: What Should You Use?
The default settings are 20 periods for the moving average and 2 standard deviations for the band width. John Bollinger himself recommended these as the optimal starting point for most markets and timeframes.
However, different trading styles benefit from adjustments:
| Settings (Period / SD) | Best For | Characteristics |
|---|---|---|
| 20 / 2 (default) | Swing trading, daily charts | Industry standard, balanced, captures 95% of price action |
| 10 / 1.5 | Day trading, scalping | Tighter bands, more responsive, more frequent signals |
| 20 / 2.5 | Reducing false signals | Wider bands, fewer touches, higher quality signals |
| 50 / 2 | Position trading, weekly charts | Very smooth, identifies major trends, few signals |
| 50 / 2.1 | Long-term analysis | Bollinger's recommendation when using 50-period MA |
There's an important rule that Bollinger himself advocates: when you increase the moving average period, increase the standard deviation multiplier slightly. With a 10-period MA, 1.5 standard deviations works well. With a 50-period MA, use at least 2.1. This keeps the bands statistically balanced. Using 2 standard deviations with a 50-period average makes the bands slightly too tight, generating false signals.
For crypto trading on the daily chart, the default 20/2 settings are your best starting point. They're the most widely watched settings, which creates a self-fulfilling element — when thousands of traders are watching the same Bollinger Band levels, those levels carry more weight.
Pro Tip: If you find the default bands generating too many signals in choppy crypto markets, try widening the standard deviation to 2.5 instead of changing the period. This keeps the moving average responsive while requiring more extreme moves to reach the bands, filtering out minor noise.
The 5 Best Ways to Use Bollinger Bands
Bollinger Bands generate five distinct types of trading signals. Each one applies in different market conditions, and knowing which signal to watch for — and which to ignore — is the key to using the bands profitably.
1. The Bollinger Squeeze (Volatility Breakout)
This is the most powerful and most famous Bollinger Band strategy. The squeeze occurs when the bands contract to an unusually narrow width, indicating that volatility has compressed significantly. Like a coiled spring, compressed volatility tends to release in an explosive move.
How to identify a squeeze: Look for the bands to narrow visibly — the upper and lower bands should be closer together than they've been in recent weeks. Many charting platforms include a "Bandwidth" indicator that quantifies this. When Bandwidth drops to its lowest levels in the past 6 months, a significant move is likely imminent.
How to trade it: The squeeze tells you when but not which direction. You need a directional indicator to determine the breakout direction. Wait for a candle to close decisively outside the bands as they begin to expand. If the breakout is above the upper band with expanding bands, go long. Below the lower band, go short. Confirm with MACD direction or volume for higher probability.
Real-World Example: Bitcoin Squeeze
Bitcoin trades between $94,000 and $97,000 for three weeks. The daily Bollinger Bands narrow from a $12,000 width to just $4,000. MACD is flat near zero, volume is declining — classic compression. Then a candle closes at $98,500, above the upper band, with 3x average volume. The bands begin expanding. Over the next 10 days, Bitcoin surges to $112,000. The squeeze predicted the explosive move — MACD and volume confirmed the direction.
The squeeze is particularly powerful in crypto because cryptocurrency markets cycle between extreme volatility and tight consolidation more dramatically than any other asset class. These compression-to-expansion cycles are Bollinger Bands' sweet spot.
2. The Bollinger Bounce (Mean Reversion)
In a range-bound market — where price is moving sideways without a clear trend — price tends to bounce between the upper and lower bands like a pinball. The bands act as dynamic support (lower band) and resistance (upper band), and the middle band acts as an equilibrium point that price repeatedly returns to.
How to trade it: When price touches the lower band in a sideways market, look for a bullish reversal candle (hammer, bullish engulfing) as a buy signal, targeting the middle band or upper band. When price touches the upper band, look for a bearish reversal candle as a sell signal, targeting the middle band or lower band.
Critical requirement: The bands must be relatively flat for this strategy to work. If the bands are sloping sharply upward or downward, you're in a trending market, and bounce trades will get crushed. Flat bands = range-bound = bounces work. Sloping bands = trending = bounces fail.
Confirm your bounce signals with RSI. If price touches the lower Bollinger Band and RSI is simultaneously below 30, you have two independent signals confirming oversold conditions. This double confirmation dramatically improves the odds.
The Bollinger Bounce works best in range-bound markets with flat bands — Image: Pexels
3. The Band Walk (Trend Continuation)
The band walk is the opposite of the bounce — and misunderstanding it is one of the costliest mistakes Bollinger Band traders make. During strong trends, price doesn't bounce off the bands. Instead, it rides along one band, repeatedly touching or exceeding it.
In a strong uptrend, candles will cluster near or above the upper band. Each pullback finds support at the middle band rather than reaching the lower band. The upper band is not acting as resistance — it's acting as a guardrail that price leans against as it climbs.
In a strong downtrend, the opposite occurs. Price rides the lower band, and rallies are capped at the middle band.
How to trade it: During a band walk, the middle band becomes your key level. In an upper band walk (uptrend), buy pullbacks to the middle band. Your stop goes below the middle band. In a lower band walk (downtrend), sell rallies to the middle band. The trend continues until price can no longer reach the outer band and starts crossing the middle band in the wrong direction.
How to identify it: At least two or three consecutive candles touching or closing beyond the outer band, with the bands themselves expanding (not flat). Volume should support the trend direction. If price keeps hitting the upper band with increasing volume, that's a strong band walk — don't fight it.
4. W-Bottoms and M-Tops (Reversal Patterns)
John Bollinger himself identified these as among the most reliable signals his bands produce. They're specific chart patterns that combine Bollinger Band analysis with classic price action.
W-Bottom (bullish reversal): Price drops to the lower band, bounces, drops again to a similar level — but this time the second low is inside the bands (doesn't touch or breach the lower band). The fact that the second low can't even reach the lower band shows that selling pressure is exhausted. When price then breaks above the reaction high between the two lows, it confirms the reversal. This creates a "W" shape on the chart.
M-Top (bearish reversal): The mirror image. Price rallies to the upper band, pulls back, rallies again — but the second high is inside the bands (doesn't touch the upper band). The failing momentum is evident in the band structure. When price breaks below the reaction low between the two highs, the reversal is confirmed. This creates an "M" shape.
Real-World Example: W-Bottom
Ethereum drops from $3,500 to $2,800, touching the lower Bollinger Band. It bounces to $3,100, then drops again to $2,850 — but this time the price stays inside the lower band. RSI shows a higher low (bullish divergence). When ETH breaks above $3,100 (the reaction high), the W-bottom is confirmed. Over the next two weeks, ETH rallies to $3,700. The Bollinger Band structure told you the second low was weaker than the first — sellers were losing their grip.
These patterns are particularly effective when combined with RSI divergences. If a W-bottom forms and RSI simultaneously shows bullish divergence (higher low while price makes a lower low), the reversal signal is very strong.
5. Bollinger Band Width as a Timing Tool
This is a more advanced application. Instead of trading band touches directly, you monitor the Bandwidth indicator (available separately on most platforms) to time when volatility cycles are about to shift.
Volatility is mean-reverting — periods of low volatility always lead to periods of high volatility, and vice versa. When Bandwidth reaches extremely low levels (relative to its historical range), you know a volatility expansion is coming. When Bandwidth reaches extremely high levels, volatility contraction is likely ahead.
This doesn't tell you direction, but it tells you when to be ready and when to adjust position sizes. Before a volatility expansion, consider smaller positions with wider stops (the move will be big but unpredictable). After a prolonged expansion, consider taking profits as volatility begins to contract.
In crypto, this is especially useful for avoiding the trap of entering positions during quiet, low-volatility periods with tight stops that immediately get blown out when the expansion arrives.
What Indicators Work Best With Bollinger Bands?
Bollinger Bands measure volatility — they don't measure momentum, trend direction, or volume. To build a complete system, pair them with indicators from these other categories.
Bollinger Bands + RSI (Volatility + Momentum)
This is one of the most effective combinations in all of technical analysis. RSI tells you how stretched momentum is, while Bollinger Bands tell you how stretched price is relative to recent volatility. When both say "oversold" or "overbought" simultaneously, the signal is significantly more reliable than either alone.
The setup: price touches the lower Bollinger Band AND RSI drops below 30. That's a double oversold signal from two independent calculations. Wait for a reversal candle, then enter long with a stop below the recent low. The reverse works at the upper band with RSI above 70.
This combination is especially powerful for the Bollinger Bounce strategy in ranging markets. RSI confirms what the bands suggest, and the false signal rate drops dramatically.
Bollinger Bands + MACD (Volatility + Trend)
This pairing solves Bollinger Bands' biggest weakness: they don't tell you trend direction. MACD fills that gap perfectly.
For the Bollinger Squeeze, MACD is essential. The squeeze tells you a big move is coming; MACD tells you which way. If MACD is above zero and trending upward during a squeeze, the breakout will likely be bullish. If MACD is below zero and trending downward, expect a bearish breakout.
For band walks, MACD confirms whether the trend has genuine momentum behind it. A price walking the upper band with MACD making higher highs is a strong uptrend. A price walking the upper band while MACD shows divergence (lower highs) is a trend about to break down.
Bollinger Bands + Volume
Volume confirms the conviction behind any Bollinger Band signal. A squeeze breakout on high volume is far more likely to follow through than one on low volume. A band touch with a reversal candle on high volume carries more weight than one with average volume.
Pay special attention to volume during the squeeze. Declining volume during the compression phase is normal — it confirms that the market is consolidating. The breakout candle should then show a significant spike in volume, confirming that traders are committing to the new direction. If the breakout occurs without a volume increase, it's more likely to be a false breakout.
Bollinger Bands + Support/Resistance
When a Bollinger Band level aligns with a key horizontal support or resistance level, that zone becomes exceptionally powerful. If the lower band sits at $90,000 and there's also a major historical support level at $90,000, that confluence makes a bounce much more likely.
This "confluence" approach — where multiple independent tools agree on the same level — is one of the most reliable methods in technical analysis. The more reasons price should react at a level, the more likely it will.
Control Your Risk on Every Trade
Bollinger Bands identify opportunities — but position sizing determines whether you survive to trade them. Never risk more than 1-2% of your capital on a single trade.
Calculate Your Position Size →Bollinger Bands Strategy for Crypto: Step-by-Step
Here's a practical, beginner-friendly strategy combining Bollinger Bands with RSI and MACD. This approach works for swing trading Bitcoin and major altcoins on the daily chart.
Step 1: Identify the Market Regime
Before looking at any signals, determine whether the market is trending or ranging. Check the Bollinger Bands: are they flat and relatively parallel (ranging), or sloping with expanding width (trending)? Check MACD: is it near zero and choppy (ranging), or clearly above or below zero (trending)? Your strategy depends entirely on this assessment.
Step 2A: Ranging Market — Trade the Bounce
If the bands are flat, trade bounces. Wait for price to touch the lower band with RSI below 35. Look for a bullish reversal candle (hammer, bullish engulfing, or morning star). Enter long with a stop below the candle's low. Target the middle band for a conservative exit, or the upper band for an aggressive one. Reverse the logic for shorts at the upper band with RSI above 65.
Step 2B: Trending Market — Trade the Band Walk
If the bands are sloping upward with expanding width and MACD is above zero, you're in an uptrend. Buy pullbacks to the middle band (20-SMA). Place your stop below the middle band. Target the upper band area. Stay in the trade as long as price keeps bouncing off the middle band and reaching the upper band. Exit if price closes below the middle band on the daily chart.
Step 2C: Squeeze Detected — Prepare for Breakout
If the bands have narrowed to their tightest width in at least a month, a squeeze is active. Check MACD direction for bias. Set alerts at the upper and lower bands. When a candle closes decisively outside a band with expanding bands and a volume spike, enter in the breakout direction. Use a stop on the opposite side of the middle band. Squeeze breakouts often produce the biggest moves — let your winners run.
Step 3: Size Your Position
Use the Position Size Calculator to determine exactly how much to risk. Bollinger Band stops can be wide (especially after squeezes), so your position size needs to account for the distance to your stop-loss. Never risk more than 1-2% of your total capital. Use the P&L Calculator to model your exact profit at different targets before entering.
A systematic approach matching your strategy to market conditions is the key to using Bollinger Bands profitably — Image: Pexels
Bollinger Bands vs. RSI vs. MACD: Which Should You Use?
The answer is: all three, because they measure completely different things. Here's how the "indicator trilogy" compares:
| Feature | Bollinger Bands | RSI | MACD |
|---|---|---|---|
| What it measures | Volatility & price extremes | Momentum speed | Trend direction & momentum |
| Type | Volatility overlay | Bounded oscillator (0-100) | Unbounded oscillator |
| Plotted on | Price chart (overlay) | Separate panel | Separate panel |
| Best market | Both trending and ranging | Ranging/sideways | Trending |
| Key strength | Predicting volatility shifts | Identifying extremes | Confirming trend changes |
| Key weakness | No directional bias | False signals in trends | Whipsaws in ranges |
| Signal types | Squeeze, bounce, walk, W/M | Overbought/oversold, divergence | Crossover, divergence, histogram |
| Covers each other's weakness? | Adds volatility context to both | Adds momentum extremes to BB | Adds direction to BB |
The ideal setup: Bollinger Bands on the price chart to visualise volatility and identify setups, RSI in the first sub-panel to confirm momentum extremes, and MACD in the second sub-panel to confirm trend direction. When all three align — for example, a Bollinger squeeze breakout to the upside with RSI above 50 and MACD bullish — you have one of the highest-probability setups in technical analysis.
For a deep dive into using each indicator, read our companion guides: RSI: The Complete Beginner's Guide and MACD: The Complete Beginner's Guide.
Bollinger Bands in Crypto vs. Traditional Markets
| Factor | Traditional Markets | Crypto Markets |
|---|---|---|
| Volatility cycles | Moderate, gradual shifts | Extreme, sudden compression-to-expansion |
| Squeeze frequency | Occasional, predictable | Frequent, powerful breakouts |
| Band walks | Orderly, trend-following | Aggressive, parabolic during bull runs |
| False breakouts | Common but manageable | Very common — always confirm with volume |
| Trading hours | Gaps distort band calculations | 24/7 — no gaps, continuous data |
| Best timeframe | All timeframes work well | Daily and weekly most reliable |
| Band width | Relatively stable | Can expand 3-5x in days during panic or euphoria |
Crypto's extreme volatility actually makes Bollinger Bands more useful than in traditional markets. The squeeze-to-breakout cycle is amplified in crypto — squeezes are tighter and breakouts are more explosive. However, false breakouts are also more common, which is why volume confirmation and additional indicators are non-negotiable in crypto trading.
The 24/7 nature of crypto is beneficial for Bollinger Bands because there are no opening gaps that can distort the moving average and standard deviation calculations. The data is continuous, which makes the statistical basis of the bands more reliable than in markets that close overnight.
Bollinger Band Mistakes That Cost Traders Money
Mistake #1: Treating every band touch as a reversal signal. This is the single most expensive Bollinger Band mistake. In strong trends, price will touch or exceed the outer band repeatedly without reversing. Always determine the market regime (trending vs. ranging) before interpreting band touches. A band touch in a range is a potential reversal. A band touch in a trend is a continuation signal.
Mistake #2: Trading the squeeze without directional confirmation. The squeeze tells you when but not where. Trading the squeeze without checking MACD direction, volume, or price structure is essentially a coin flip. Always wait for the breakout candle AND confirm direction before entering.
Mistake #3: Forgetting the middle band. Many traders focus exclusively on the outer bands and ignore the 20-period SMA in the middle. The middle band is a powerful dynamic support/resistance level. During trends, it's your pullback entry level. During ranges, it's your first target from band trades. Ignoring it means missing half the information the indicator provides.
Mistake #4: Using the same strategy in every market condition. The bounce strategy works in ranges and fails in trends. The band walk strategy works in trends and fails in ranges. If you apply one strategy regardless of conditions, you'll be wrong roughly half the time. Read the bands' slope and width first, then choose your strategy.
Mistake #5: Setting stops too tight after squeezes. Squeeze breakouts are volatile by definition — that's the whole point. A tight stop will get hit immediately as price whipsaws in the early stages of the breakout. Give squeeze trades room to breathe. Place stops on the opposite side of the middle band, and size your position accordingly using the position sizing principles we've covered elsewhere.
Mistake #6: Using Bollinger Bands alone. Bollinger himself has always emphasised that his bands should be combined with other indicators. The bands measure volatility — they don't measure momentum (use RSI), trend direction (use MACD), or conviction (use volume). A complete system needs all of these elements.
⚠️ John Bollinger's Own Advice: "Bollinger Bands are not a standalone trading system. They are simply one indicator designed to provide traders with information regarding price volatility." Always use them as part of a broader analytical framework that includes risk management, position sizing, and complementary indicators.
Quick Reference: Bollinger Bands Cheat Sheet
| Signal | What It Means | Action to Consider |
|---|---|---|
| Bands narrowing (squeeze) | Volatility compressing, breakout imminent | Set alerts, check MACD for direction, prepare to trade the breakout |
| Bands expanding | Volatility increasing, trend in progress | Trade with the trend, avoid counter-trend entries |
| Price at upper band (ranging) | Statistically extended to upside | Look for short/sell signals with RSI confirmation |
| Price at lower band (ranging) | Statistically extended to downside | Look for long/buy signals with RSI confirmation |
| Price walking upper band | Strong uptrend in progress | Buy pullbacks to the middle band, don't short |
| Price walking lower band | Strong downtrend in progress | Sell rallies to the middle band, don't buy dips |
| Price bouncing off middle band | Middle band acting as support/resistance | Confirms trend direction — trade the bounce |
| W-bottom pattern | Second low weaker than first (inside bands) | Bullish reversal — buy break above reaction high |
| M-top pattern | Second high weaker than first (inside bands) | Bearish reversal — sell break below reaction low |
Setting Up Bollinger Bands on TradingView
Step 1: Open any chart on TradingView (e.g., BTCUSDT on Binance).
Step 2: Click the "Indicators" button at the top of the chart (or press the "/" key).
Step 3: Type "Bollinger" in the search box and select "Bollinger Bands" from the built-in indicators.
Step 4: The bands will appear directly on your price chart — an upper band, lower band, and middle line, with the area between shaded. This overlay format means you can immediately see how price relates to the bands.
Step 5: To customise, click the indicator label and then the gear icon. You can adjust the length (default 20), the standard deviation multiplier (default 2), and the moving average type (SMA is standard, but EMA is available for more responsiveness).
The complete setup: For the full indicator trilogy, add Bollinger Bands on the chart, then add RSI and MACD as separate panel indicators below. You'll have volatility on the chart, momentum in the first panel, and trend direction in the second. This three-layer view gives you a comprehensive read on market conditions at a glance.
Model Every Exit Before You Enter
Bollinger Bands give you clear targets — the middle band, the opposite band, or beyond. Use the P&L Calculator to see exactly what each exit is worth, so you can set realistic targets and manage your trades with confidence.
Calculate Your P&L Now →The Bottom Line: Bollinger Bands Complete Your Technical Toolkit
Bollinger Bands fill a gap that no other common indicator covers — volatility. While RSI tells you about momentum extremes and MACD tells you about trend direction, Bollinger Bands tell you whether the market is compressed and ready to explode, or extended and ready to revert. Together, these three indicators form a complete analytical framework that covers the three core dimensions of market analysis: trend, momentum, and volatility.
The most important lessons to carry forward: always identify the market regime before choosing your Bollinger Band strategy. The squeeze is your highest-probability setup but needs directional confirmation. Band touches mean different things in trends versus ranges — context is everything. The middle band is more important than most traders realise. And Bollinger Bands should never be used alone.
Start with the default 20/2 settings on the daily chart. Add RSI and MACD below. Watch how the bands behave during different market phases — squeeze, expansion, trend, range. Paper trade the bounce and squeeze strategies until you can identify setups instinctively. Then, with proper position sizing and stop-loss discipline, start trading them with real capital.
Volatility isn't something to fear — it's something to measure, prepare for, and profit from. That's exactly what Bollinger Bands help you do.