What Is Stan Weinstein’s Stage Analysis?
Stan Weinstein’s Stage Analysis is a classic market framework designed to identify where an asset is in its life cycle.
Instead of predicting price, it focuses on market behaviour — helping traders decide when to buy, when to hold, and when to stay out.
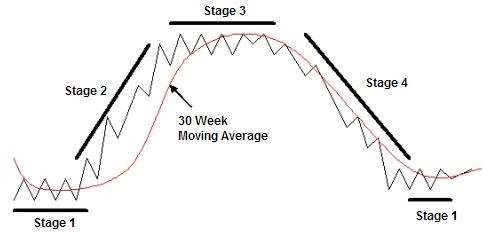
The theory divides all markets into four repeating stages:
Stage 1 – Accumulation: Sideways movement after a decline
Stage 2 – Advancing: Strong uptrend (this is where big money is made)
Stage 3 – Distribution: Topping phase near highs
Stage 4 – Declining: Sustained downtrend
Markets always move through these stages in order.
The key is only being aggressive during Stage 2 and defensive everywhere else.
📌 Weinstein’s core rule:
“Most investors lose money because they try to buy Stage 3 and Stage 4.”
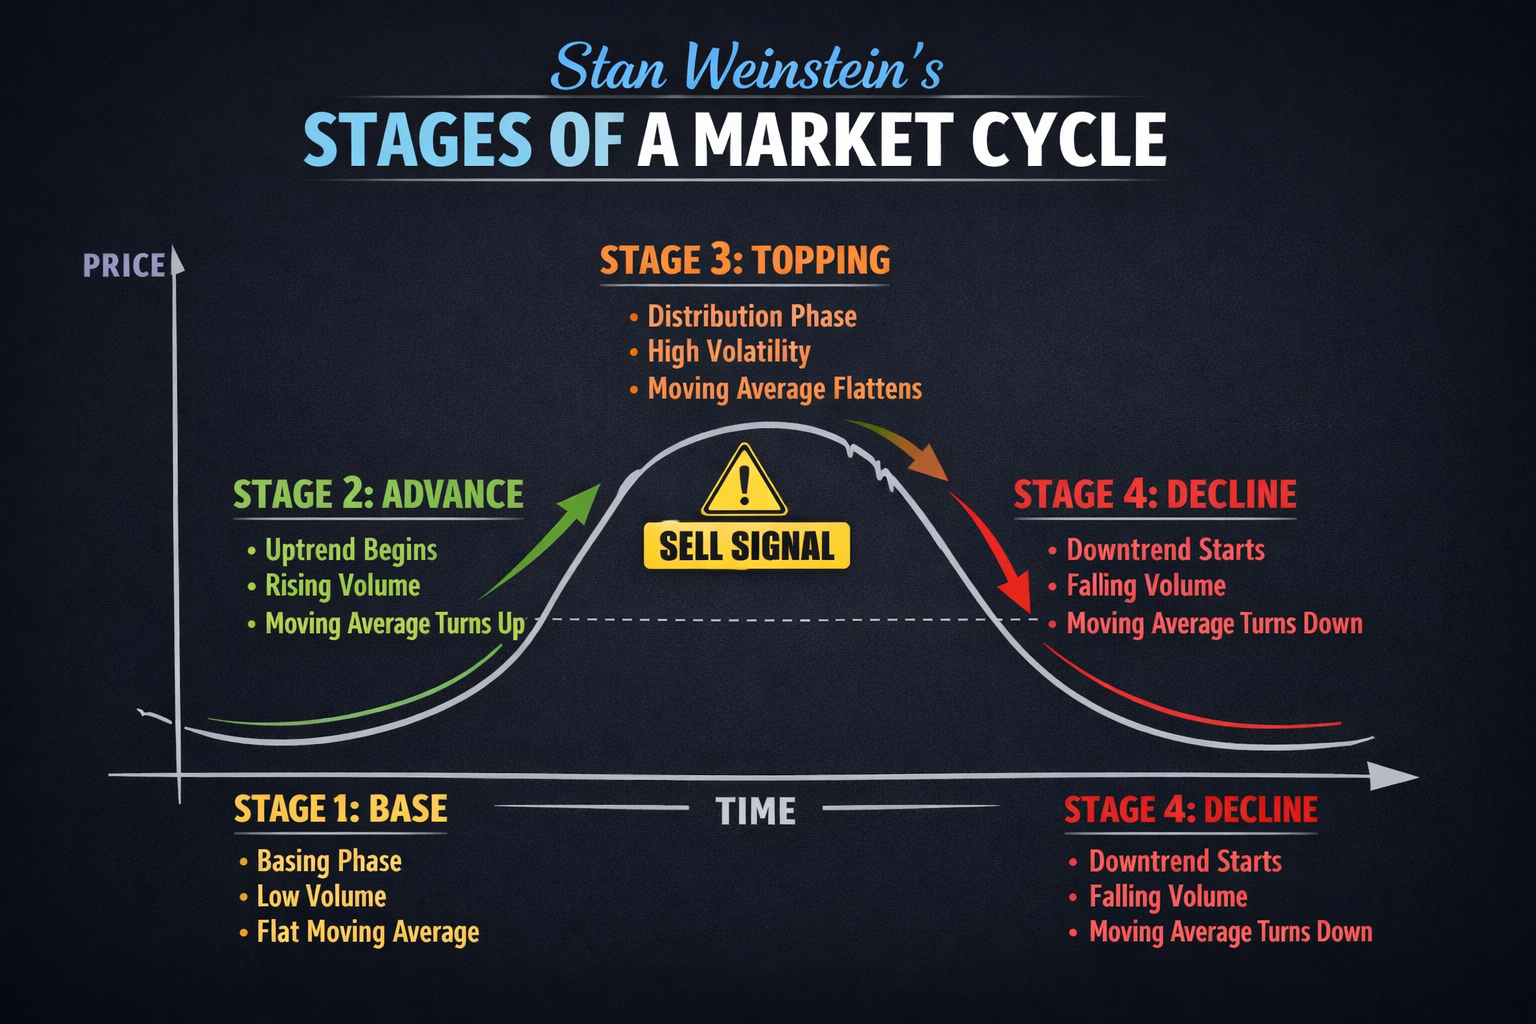
A Quick Overview of the Four Stages
Here’s a simplified breakdown of how each stage behaves:
Stage 1 – Accumulation
Price moves sideways in a range. Volatility is low, interest is minimal, and momentum is flat.
Stage 2 – Advancing
Price breaks out of the range and trends higher. Pullbacks are shallow, momentum is strong, and buyers are in control.
Stage 3 – Distribution
Price struggles to make new highs. Volatility increases, breakouts fail, and smart money begins exiting.
Stage 4 – Declining
Lower highs and lower lows form. Rallies are weak and sold into. Capital preservation becomes the priority.
Understanding these stages removes emotion and replaces guesswork with structure.
Why Stage Analysis Works So Well for Bitcoin
Bitcoin is particularly suited to Stage Analysis because: It moves in clear cycles It attracts strong emotional behaviour near tops and bottoms Institutional participation creates textbook distribution and accumulation Unlike short-term indicators, Stage Analysis focuses on structure, not noise. This makes it ideal for identifying high-risk vs low-risk environments in Bitcoin.
Where Is Bitcoin Right Now?
Based on current price behaviour, Bitcoin is no longer in Stage 2.
The chart shows:
A completed strong advance (former Stage 2)broad topping structure near the highs, a failed attempts to continue higher. A sharp decline followed by weak, overlapping bounces. This is classic Stage 3 transitioning into early Stage 4.
In simple terms:
The uptrend has lost control, distribution has already occurred, the market is now vulnerable to further downside unless structure is reclaimed Importantly, Stage 4 does not begin with a crash — it begins with failed recoveries, which is exactly what we are seeing now.
What Would Confirm a Full Stage 4 Decline?
According to Weinstein’s rules, Stage 4 becomes confirmed if: Price forms another lower high Key support levels fail Rallies remain corrective rather than impulsive Downside momentum expands Until Bitcoin can reclaim prior structure with strength, the risk remains elevated. This does not mean price cannot bounce — it means the environment is no longer favourable for aggressive long positions.
What Traders Should Be Doing Now
From a Weinstein perspective, the current environment suggests:
❌ Avoid chasing longs
❌ Avoid “hoping” for continuation
✅ Reduce exposure
✅ Preserve capital
✅ Wait for clarity
The next high-probability opportunities will come from:
A clean Stage 1 base
Or a confirmed new Stage 2 breakout
Patience is a position.
Final Thoughts
Stan Weinstein’s Stage Analysis offers one of the clearest ways to understand Bitcoin’s market cycle without emotion or prediction. Right now, Bitcoin is in a high-risk transition phase, not a confirmed uptrend. History shows that the traders who survive and thrive are not the most aggressive — they are the most disciplined. Direction is optional. Risk control is not.