Market Cipher B is the oscillator package at the core of the Market Cipher system by CF Strategies LLC — a TradingView-based suite built for traders who want professional-grade signals without cluttering their chart with five separate indicators at once. MCB combines five fine-tuned algorithms into a single pane, and when those algorithms converge, it paints the signals traders have come to rely on for identifying significant moves across crypto, stocks, forex, and commodities.
This guide covers every component, every signal type, and the setups — including the ones most traders never talk about — that consistently produce the highest-probability edge.
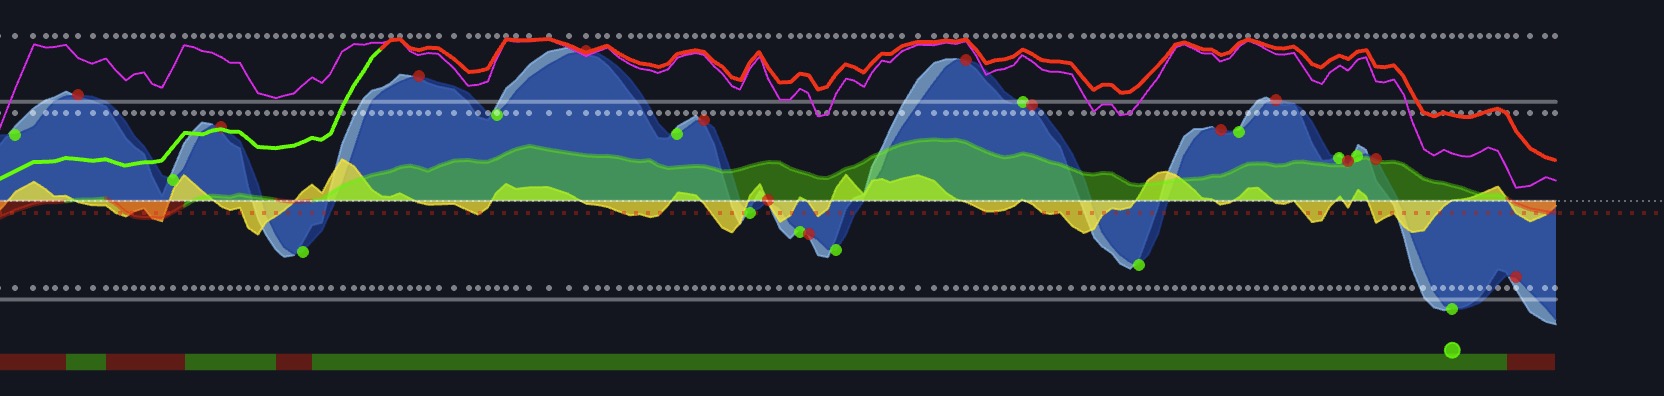
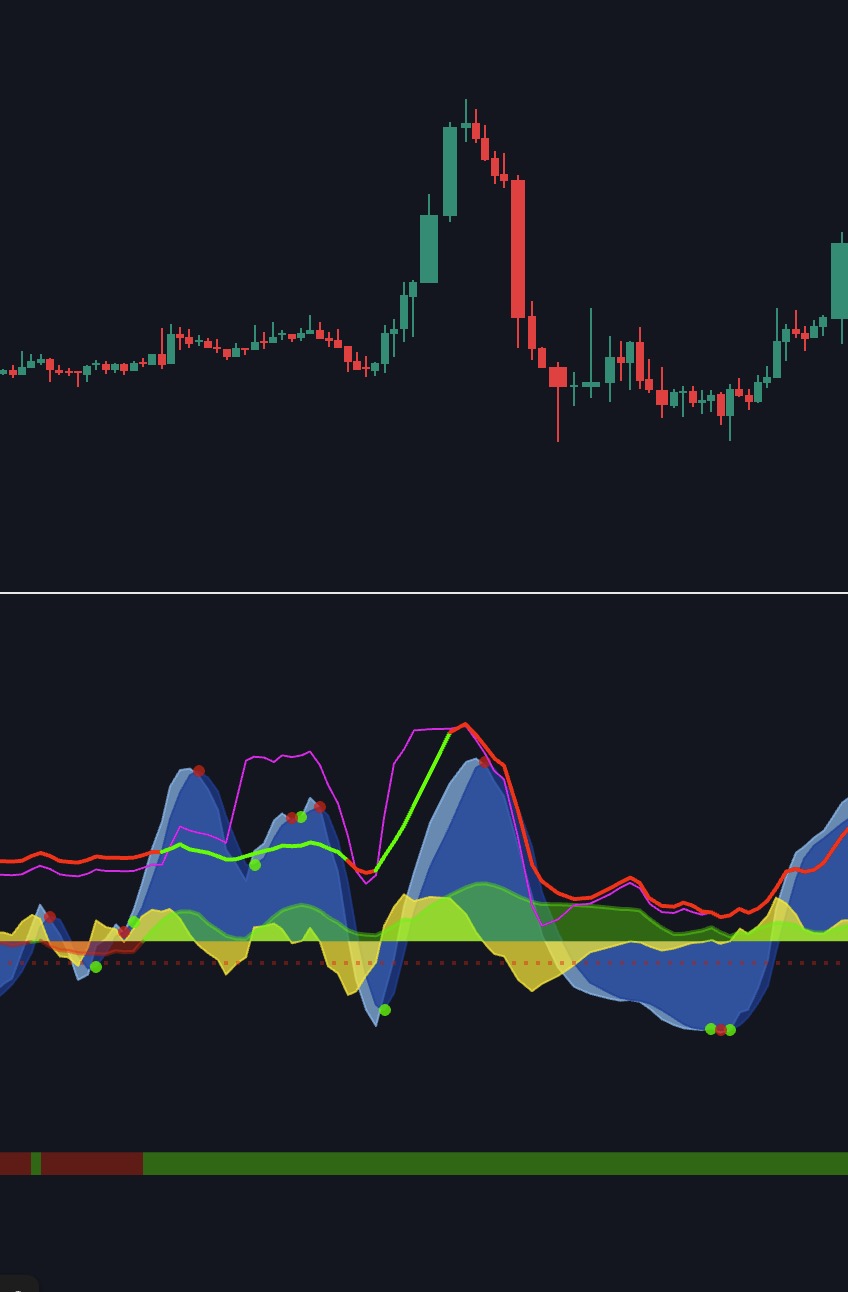
Market Cipher B in a bullish environment — momentum waves, green dots at oversold, and the money flow wave staying predominantly green throughout the uptrend.
What's Inside Market Cipher B?
MCB is not one indicator — it is five algorithms, all tuned to interact with each other. Understanding what each layer actually measures completely changes how you read the chart.
MCB Line Colour Reference
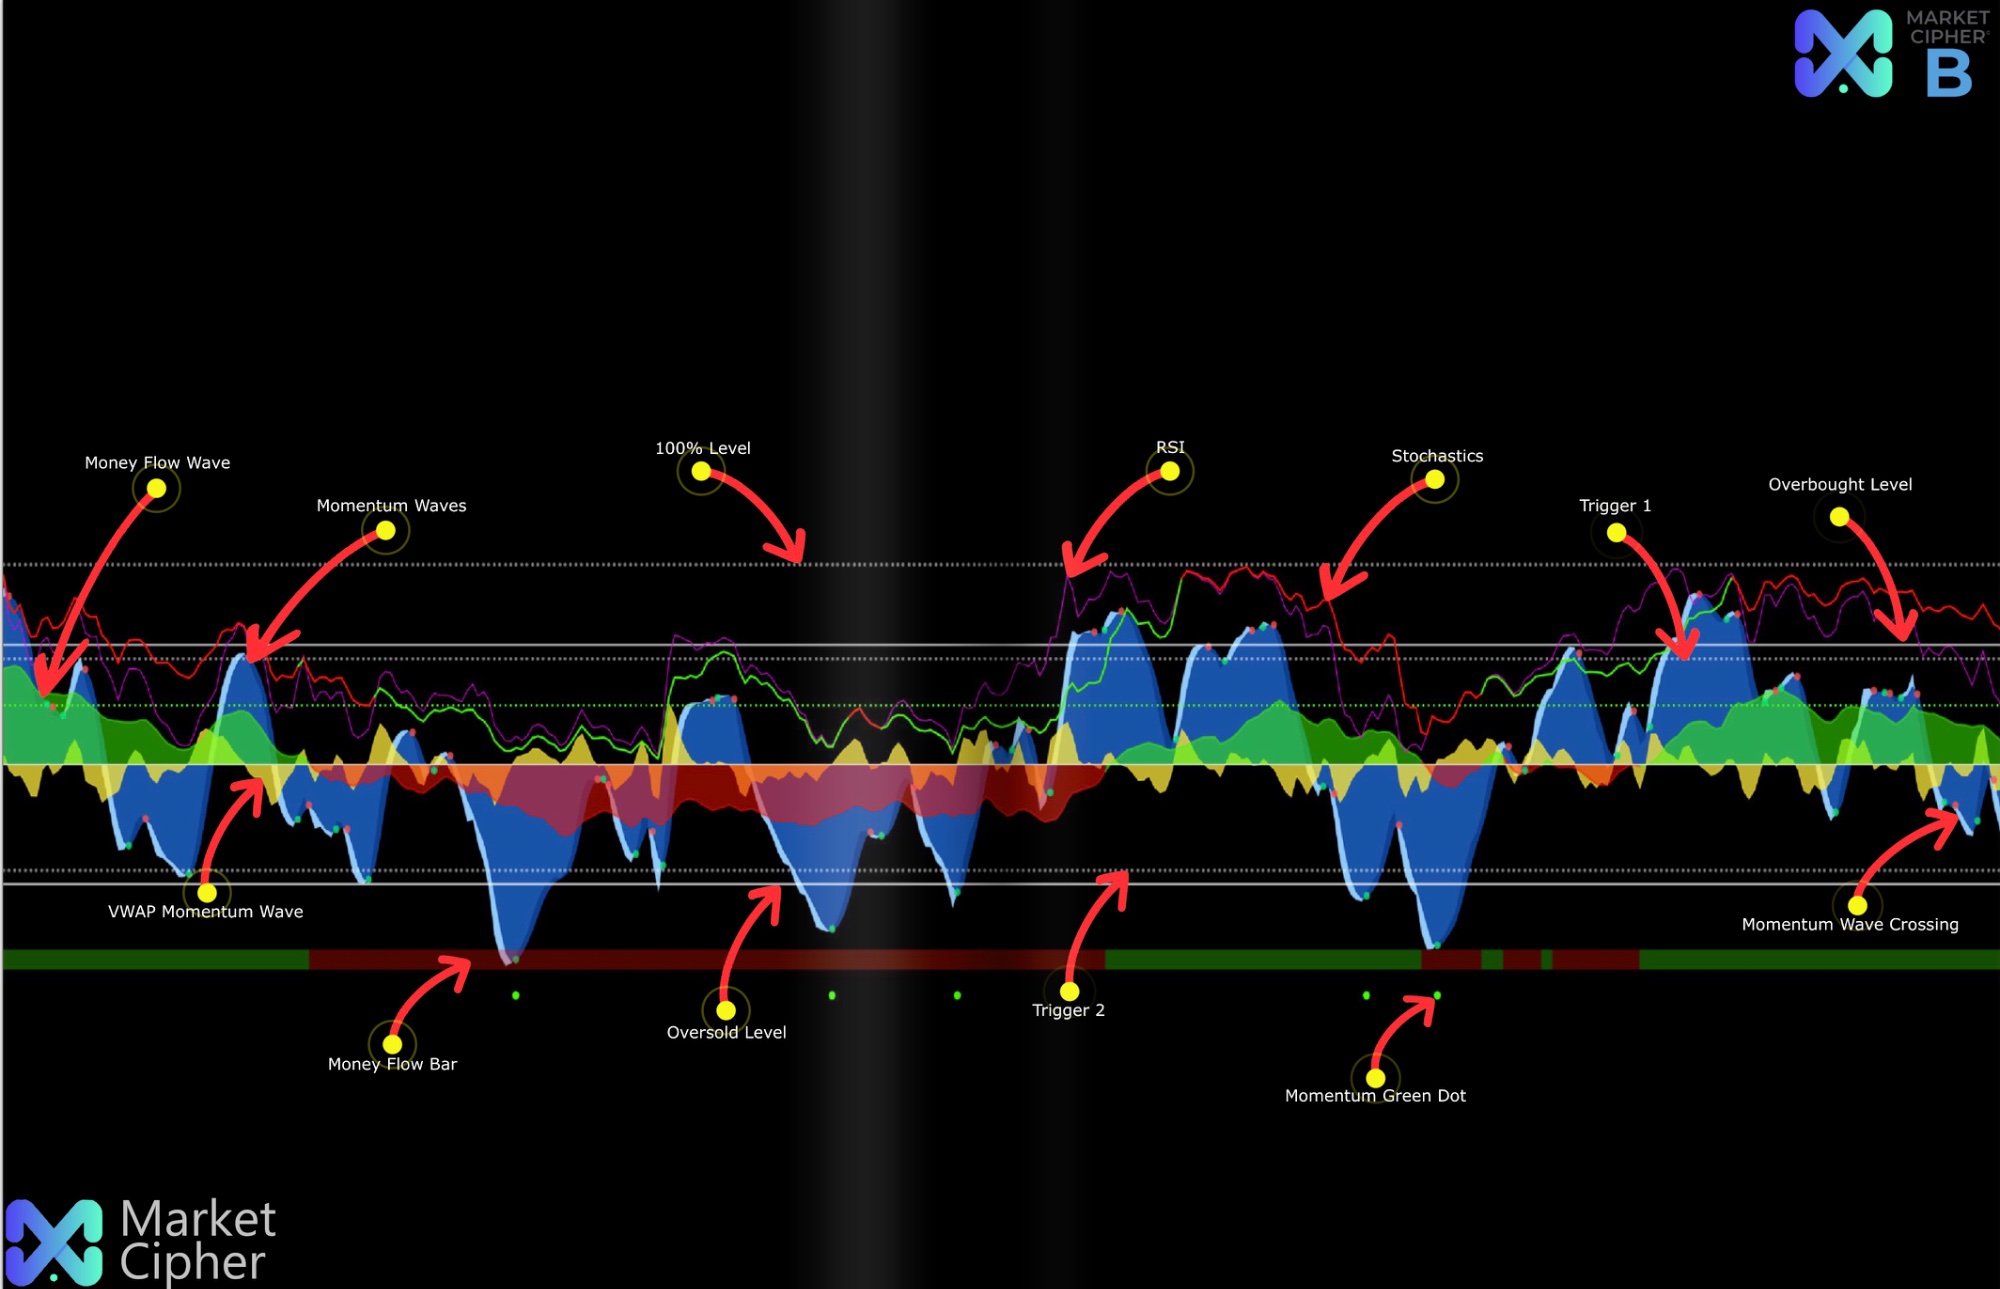
The Momentum Waves (WT1 & WT2 — The Blue Waves)
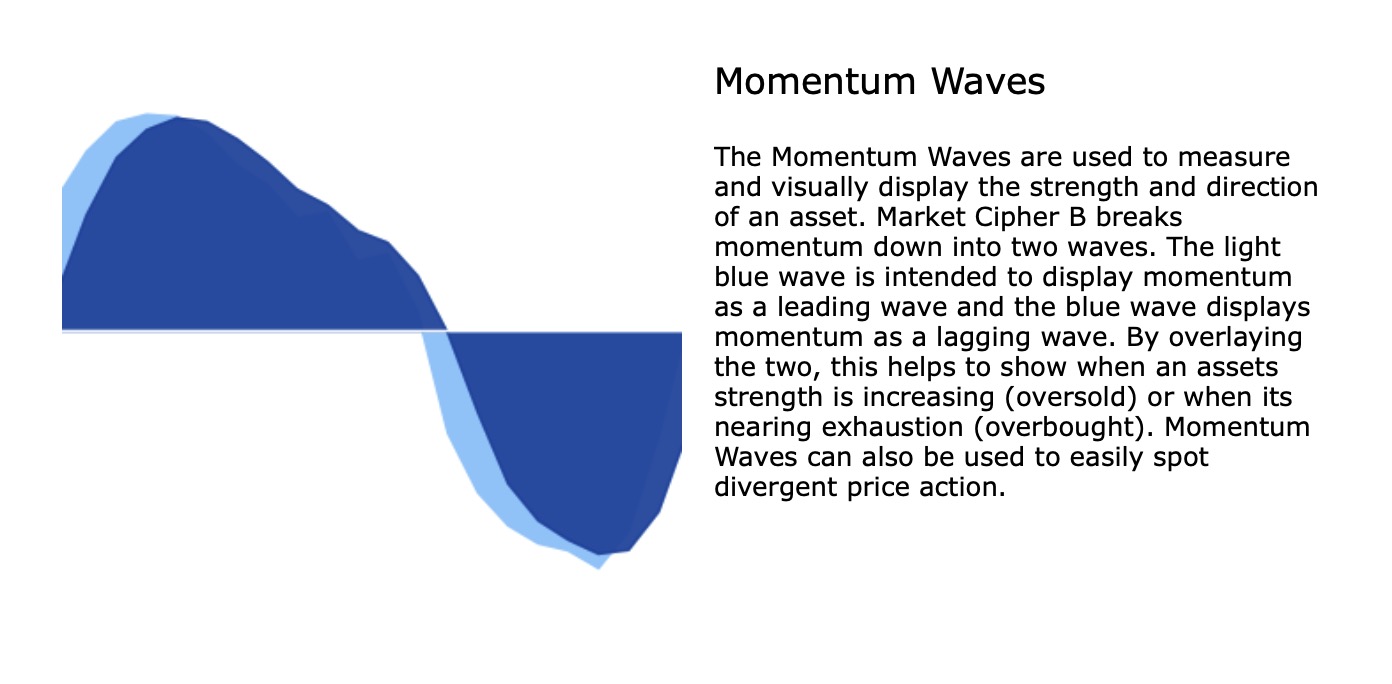
The momentum waves are the backbone of MCB. A faster light-blue leading wave (WT1) and a slower, heavier blue lagging wave (WT2) are derived from a WaveTrend algorithm applied to a synthetic price channel. Together they measure the strength and direction of the current move.
- WT1 above WT2 and climbing — bullish momentum is building
- WT1 crossing below WT2 — momentum is shifting bearish
- Waves flat and compressed near the zero line — the market is coiling before a bigger move
- The width of the gap between the two waves reflects current momentum strength
- Success has historically been found longing when the waves cross over zero and shorting when they cross under zero
- When in oversold territory, the waves signal the asset's strength is increasing; when overbought, the asset is nearing exhaustion
Anchor & Trigger Waves — Official MCB Terminology: The first wave formation in an oversold area absorbs the worst of the selling and establishes the low. A second, smaller wave that forms after a minor pullback — and then curls upward — gives confirmation that selling is genuinely exhausted. Entering on this second confirmation rather than the first touch of oversold gives a tighter stop and better risk/reward. The official MCB documentation describes WT1 as the leading wave and WT2 as the lagging wave — reading the relationship between them is the core skill. Importantly, anchor and trigger are official Market Cipher B terms, confirmed in the official guide: "This indication is also useful when used as a pivot or anchor point waiting for a trigger wave to form."
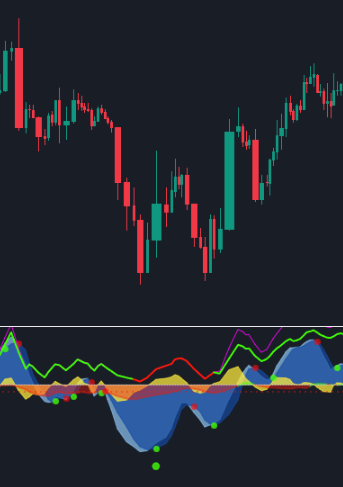
Double-dip entry example — two green dots forming a W-shape in the MCB oversold zone. The second dot (trigger) gives confirmation the anchor wasn't a false bottom.
The Momentum Green Dot — MCB's Core Signal
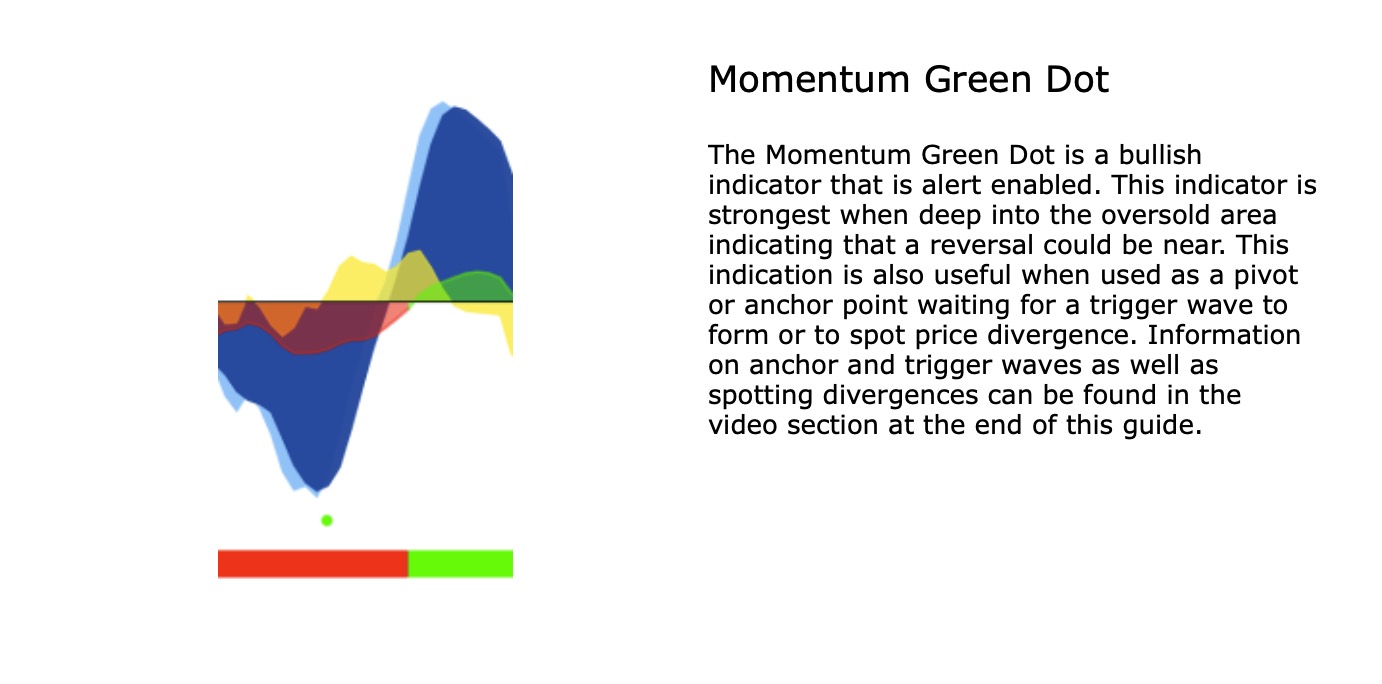
When all five algorithms in Market Cipher B converge, the indicator renders a Momentum Green Dot (the official name used in MCB's documentation). This is the primary buy signal. The official Market Cipher documentation is clear: the Green Dot "will aid you in longing the dips in bull markets as well as temporarily exiting shorts in bear markets" and "is often accompanied by extreme sellers' momentum" — warning of potential market bottoms.
There are three signal types to know:
| Signal Type | Condition | Signal Quality |
|---|---|---|
| Momentum Wave Crossing (little circle) | WT1 crosses WT2 anywhere on the chart — no oversold requirement | Low — directional alert only; needs significant additional confluence |
| Green Circle (Green Dot) | All five algorithms converge; wavetrend in oversold territory | Medium–High — MCB's primary buy signal; strength increases the deeper in oversold it prints |
| Green Dot + Divergence | Green Dot appearing below the MFI bar — bullish divergence confirmed on WT/RSI/StochRSI | Highest — two independent components agreeing on a reversal simultaneously |
⚠️ Note on "Golden Circle" terminology: The "Golden Circle" or golden dot is a feature of the VuManChu Cipher B clone and similar free open-source implementations — it is not a signal in the official Market Cipher B from CryptoFace. If you have seen it referenced in MCB guides online, those guides are likely drawing from VuManChu documentation. The official MCB has the Green Dot as its primary signal, with quality determined by depth of oversold and divergence confirmation.
The deeper in oversold territory the Green Dot prints, the more sellers have been exhausted and the higher the potential for a significant reversal. A Green Dot at an extreme low reading on the daily or weekly chart, particularly at a significant structural support level, carries the most weight the indicator can generate.
The Money Flow Wave
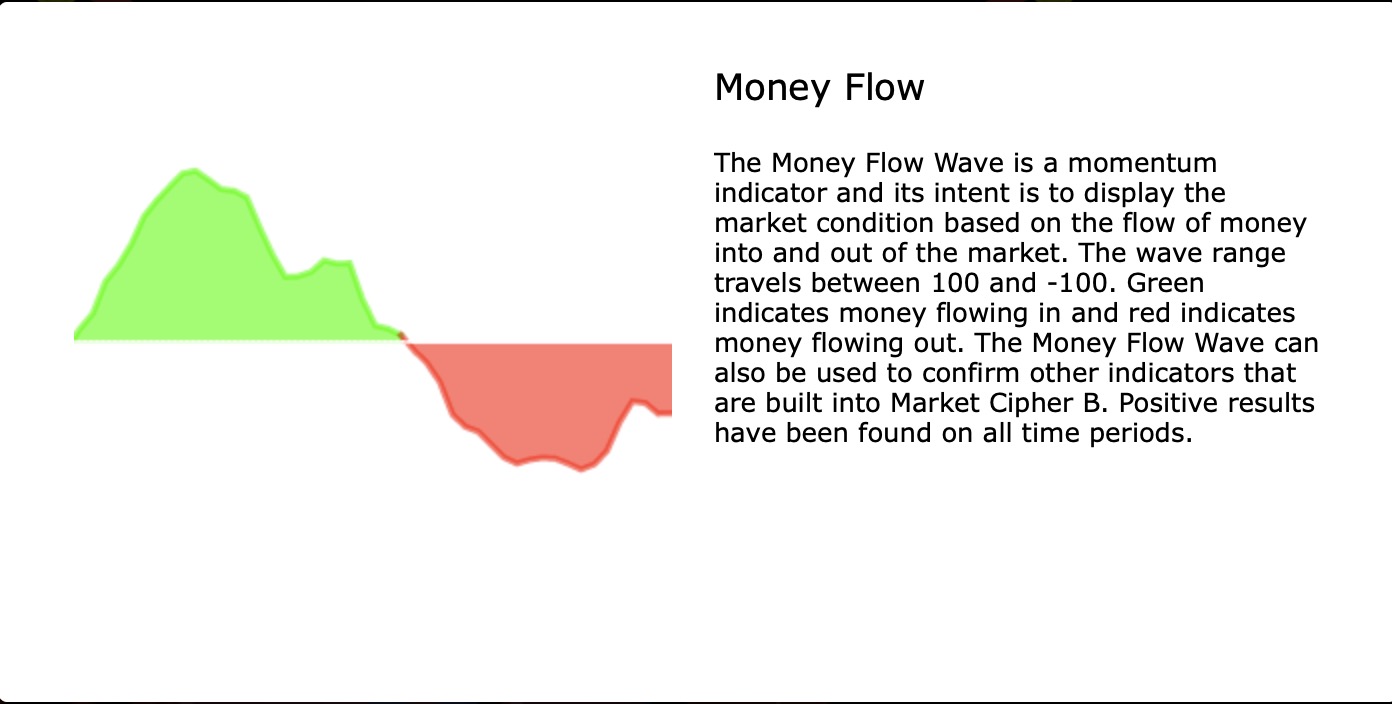
The Money Flow Wave measures capital flowing into and out of the market, oscillating between +100 and −100. Green waves signal money flowing in; red waves signal money flowing out. This component can be used to confirm other signals or as a standalone directional tool.
- Thick, sustained green wave — a bullish move has real capital participation behind it
- Thin or choppy green waves — buying is weak; be cautious on entries
- Extreme green peaks can signal distribution — money flowing out at the top of a run-up; useful as a partial exit signal
- Extreme red bottoms can signal accumulation — institutional buying into weakness
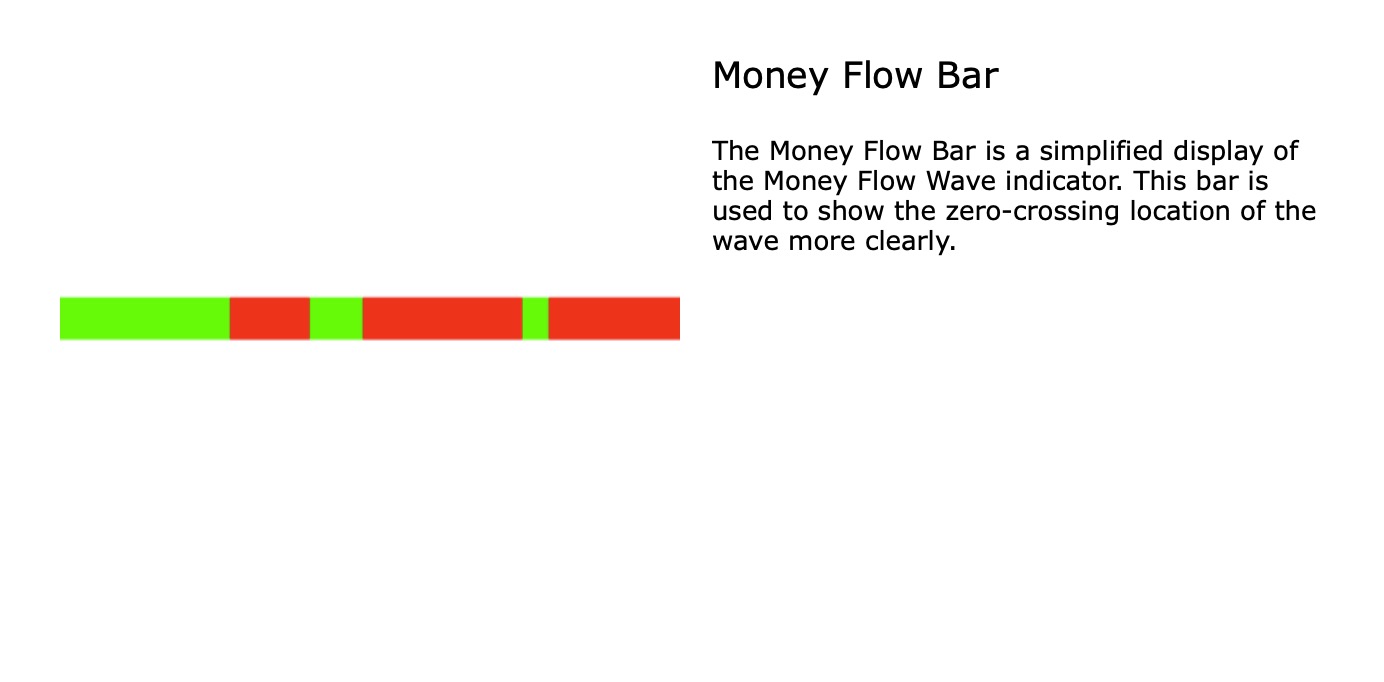
The Money Flow Bar at the base of MCB shows the zero-crossing of this wave with greater visual clarity — a green bar means the wave is positive, red means negative.
Hidden Divergence on Money Flow (Underused Setup): When price makes a higher low but the Money Flow Wave makes a lower low simultaneously, that is hidden bullish divergence — the underlying capital flow is weakening even as price holds up. This warns of a potential downside break even when the price chart looks constructive. Works equally well in reverse for identifying short setups. This divergence type is rarely documented in tutorials but is one of the most useful advanced reads on this component.
The VWAP Momentum Wave — The Inverted Logic
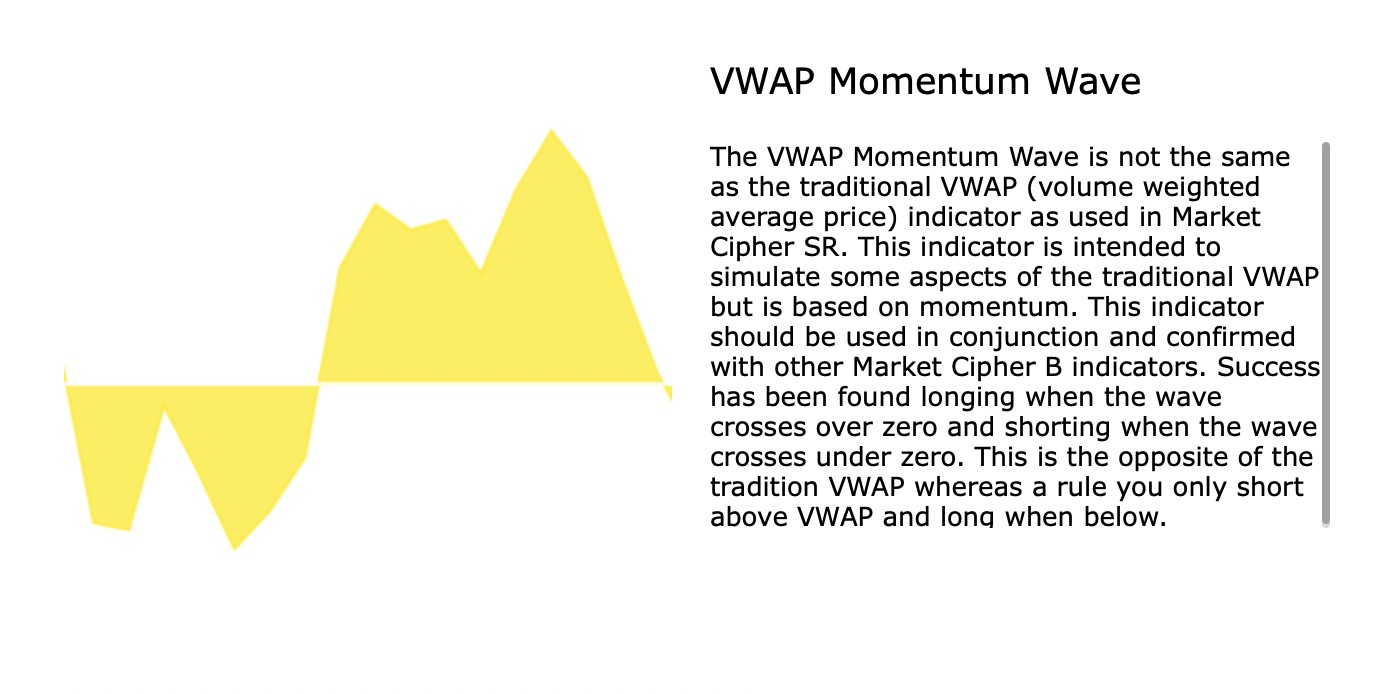
This is not the traditional VWAP used on a price chart for day trading. MCB converts VWAP into an oscillator — and critically, the rules are inverted from standard VWAP logic. This is explicitly stated in the official Market Cipher documentation: "This is the opposite of the traditional VWAP whereas a rule you only short above VWAP and long when below."
- VWAP wave crosses up → bullish — stay long until the next cross down
- VWAP wave crosses down → bearish — directional bias is short until the next cross up
- Works particularly well on shorter timeframes (15m–1H) for establishing directional bias
⚠️ Common Mistake: Traders familiar with traditional VWAP frequently apply the standard rules to MCB's VWAP component and end up taking trades in the wrong direction on every signal. If you are getting consistent losses using the VWAP wave, check whether you have the direction inverted. The official documentation is unambiguous: cross up = long, cross down = short — the opposite of traditional VWAP.
Stochastics (officially called "Stochastics" in MCB — green = bullish / red = bearish)
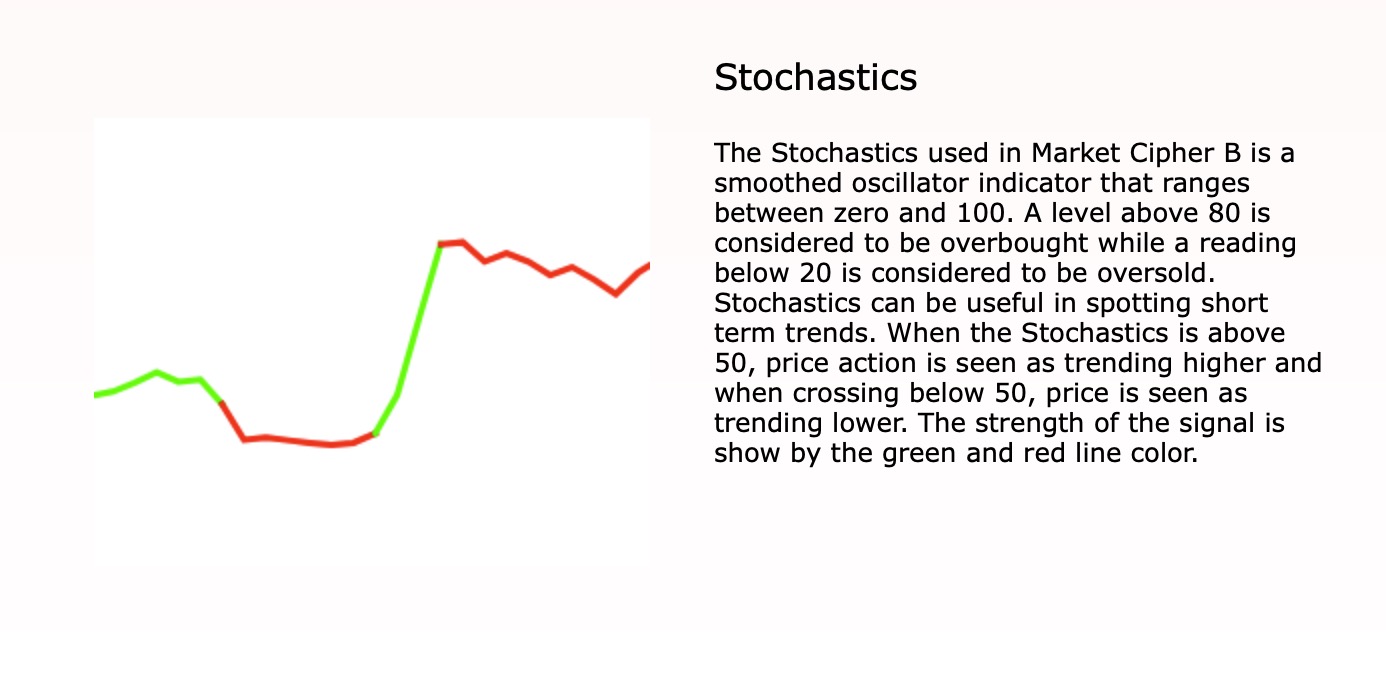
The Stochastics in MCB is a smoothed oscillator that ranges between zero and 100. The strength of the signal is shown by the line colour — green when trending bullish, red when trending bearish. When above 50, price action is seen as trending higher; when crossing below 50, price is seen as trending lower.
- Above 80 — overbought; watch for reversal signals
- Below 20 — oversold; watch for bounce signals
- Crossing 50 upward — bullish bias shift
- Crossing 50 downward — bearish bias shift
- On the weekly chart, the Stoch RSI can hold a single colour state for months — when it finally transitions, that change often marks a macro momentum shift worth noting
RSI (magenta/pink line)
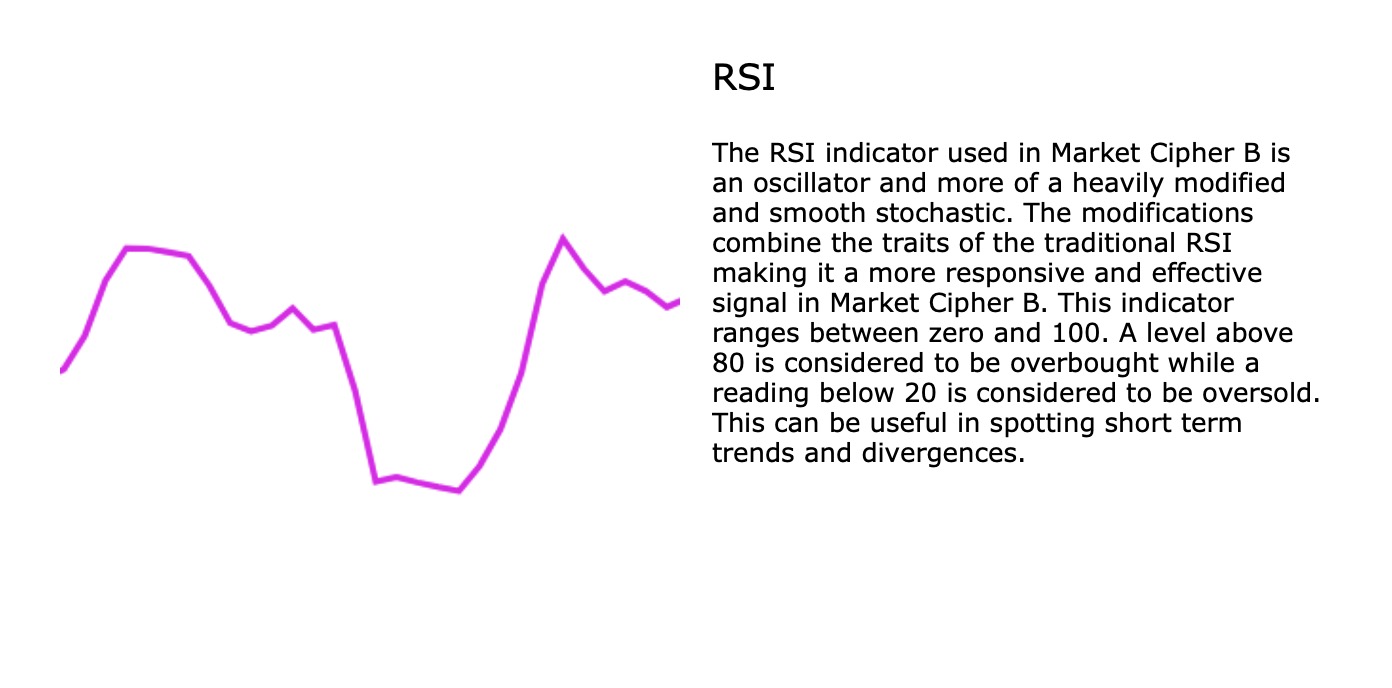
The RSI in MCB is described by the official documentation as "a heavily modified and smooth stochastic" — more responsive than the standard RSI and specifically tuned for use within the MCB system. It displays as the magenta/pink line in the indicator pane. It ranges between zero and 100, with above 80 considered overbought and below 20 oversold. Its primary roles within MCB are identifying divergences and confirming the direction of the Stochastic RSI signal.
The 100% Scale Level
The 100% Scale Level is the maximum level that the RSI and Stochastics indicators travel within Market Cipher B. The centre line of the entire MCB pane is zero — waves above zero indicate bullish territory, waves below indicate bearish territory. Understanding this scale helps contextualise where the RSI and Stochastics readings sit relative to their absolute maximum.
Trigger 1 & Trigger 2 — Alert Lines
Both Trigger levels are adjustable horizontal lines in MCB's settings, used to set custom TradingView alerts. They are not signals themselves — they are configurable thresholds that let you be notified before a signal fully prints, giving preparation time rather than forcing a reactive entry.
- Set Trigger 2 slightly above the oversold line to get early warning when the market is approaching the Green Dot zone
- Both the Oversold Level and Overbought Level are also independently adjustable
- The default levels are a starting point — adjust them to match the asset and timeframe you are trading
The 7 Best Setups Using Market Cipher B
Here are the seven primary setups that produce the highest-probability results with MCB, from the most widely known to the advanced strategies the community rarely documents.
1. Green Dot at Extreme Oversold + Structural Support (Highest Conviction)
The setup MCB was built for. When a Green Dot prints at a deep oversold reading on the daily or weekly chart — and that moment coincides with a significant price-chart support level such as a previous all-time high, a major Fibonacci retracement, or a well-respected moving average — the probability of a significant reversal is at its highest. The deeper the oversold reading when the dot prints, the more sellers have been exhausted.
How to Trade It
- Confirm on the daily or weekly chart first — lower timeframes reduce the significance of the signal
- Confluence check: is price at a level the broader market is watching? Structure matters
- The Green Dot with divergence confirmation (below MFI bar) is the highest quality version
- Entry: candle close or next open after the signal prints
- Stop: below the candle low with appropriate buffer — this is a swing trade, not a scalp
- Targets: scale out at the zero line, and then at major overhead resistance levels
2. The Double-Dip Entry — Confirmation After Oversold
One of MCB's most reliable entry techniques for buying off lows. When MCB first reaches oversold and a Green Dot prints, treat that as the initial signal — but don't necessarily enter immediately. Wait for price to pull back slightly and a second, smaller wave formation to develop. When that second wave bounces and WT1 crosses back up, that is your confirmed entry.
The reason: the first Green Dot can print while the market is still mid-capitulation. Entering on the confirmation means your stop is tighter against the second wave's low — giving a materially better risk/reward than entering blind on the first dot. You sacrifice a small portion of the initial bounce in exchange for confirmation that the selling is actually exhausted.
3. Green Dot + Divergence (Below MFI Bar)
When the Green Dot prints below the Money Flow Bar, MCB has automatically detected a divergence between the wavetrend and at least one of the RSI or Stochastic RSI components. Price and momentum are disagreeing — and momentum is turning. No manual divergence drawing required.
- Most reliable on 4H and daily — lower timeframes produce significantly more noise
- Most reliable when the Money Flow Wave is simultaneously turning from red to green
- Entry on the candle close or next open after the divergence signal confirms
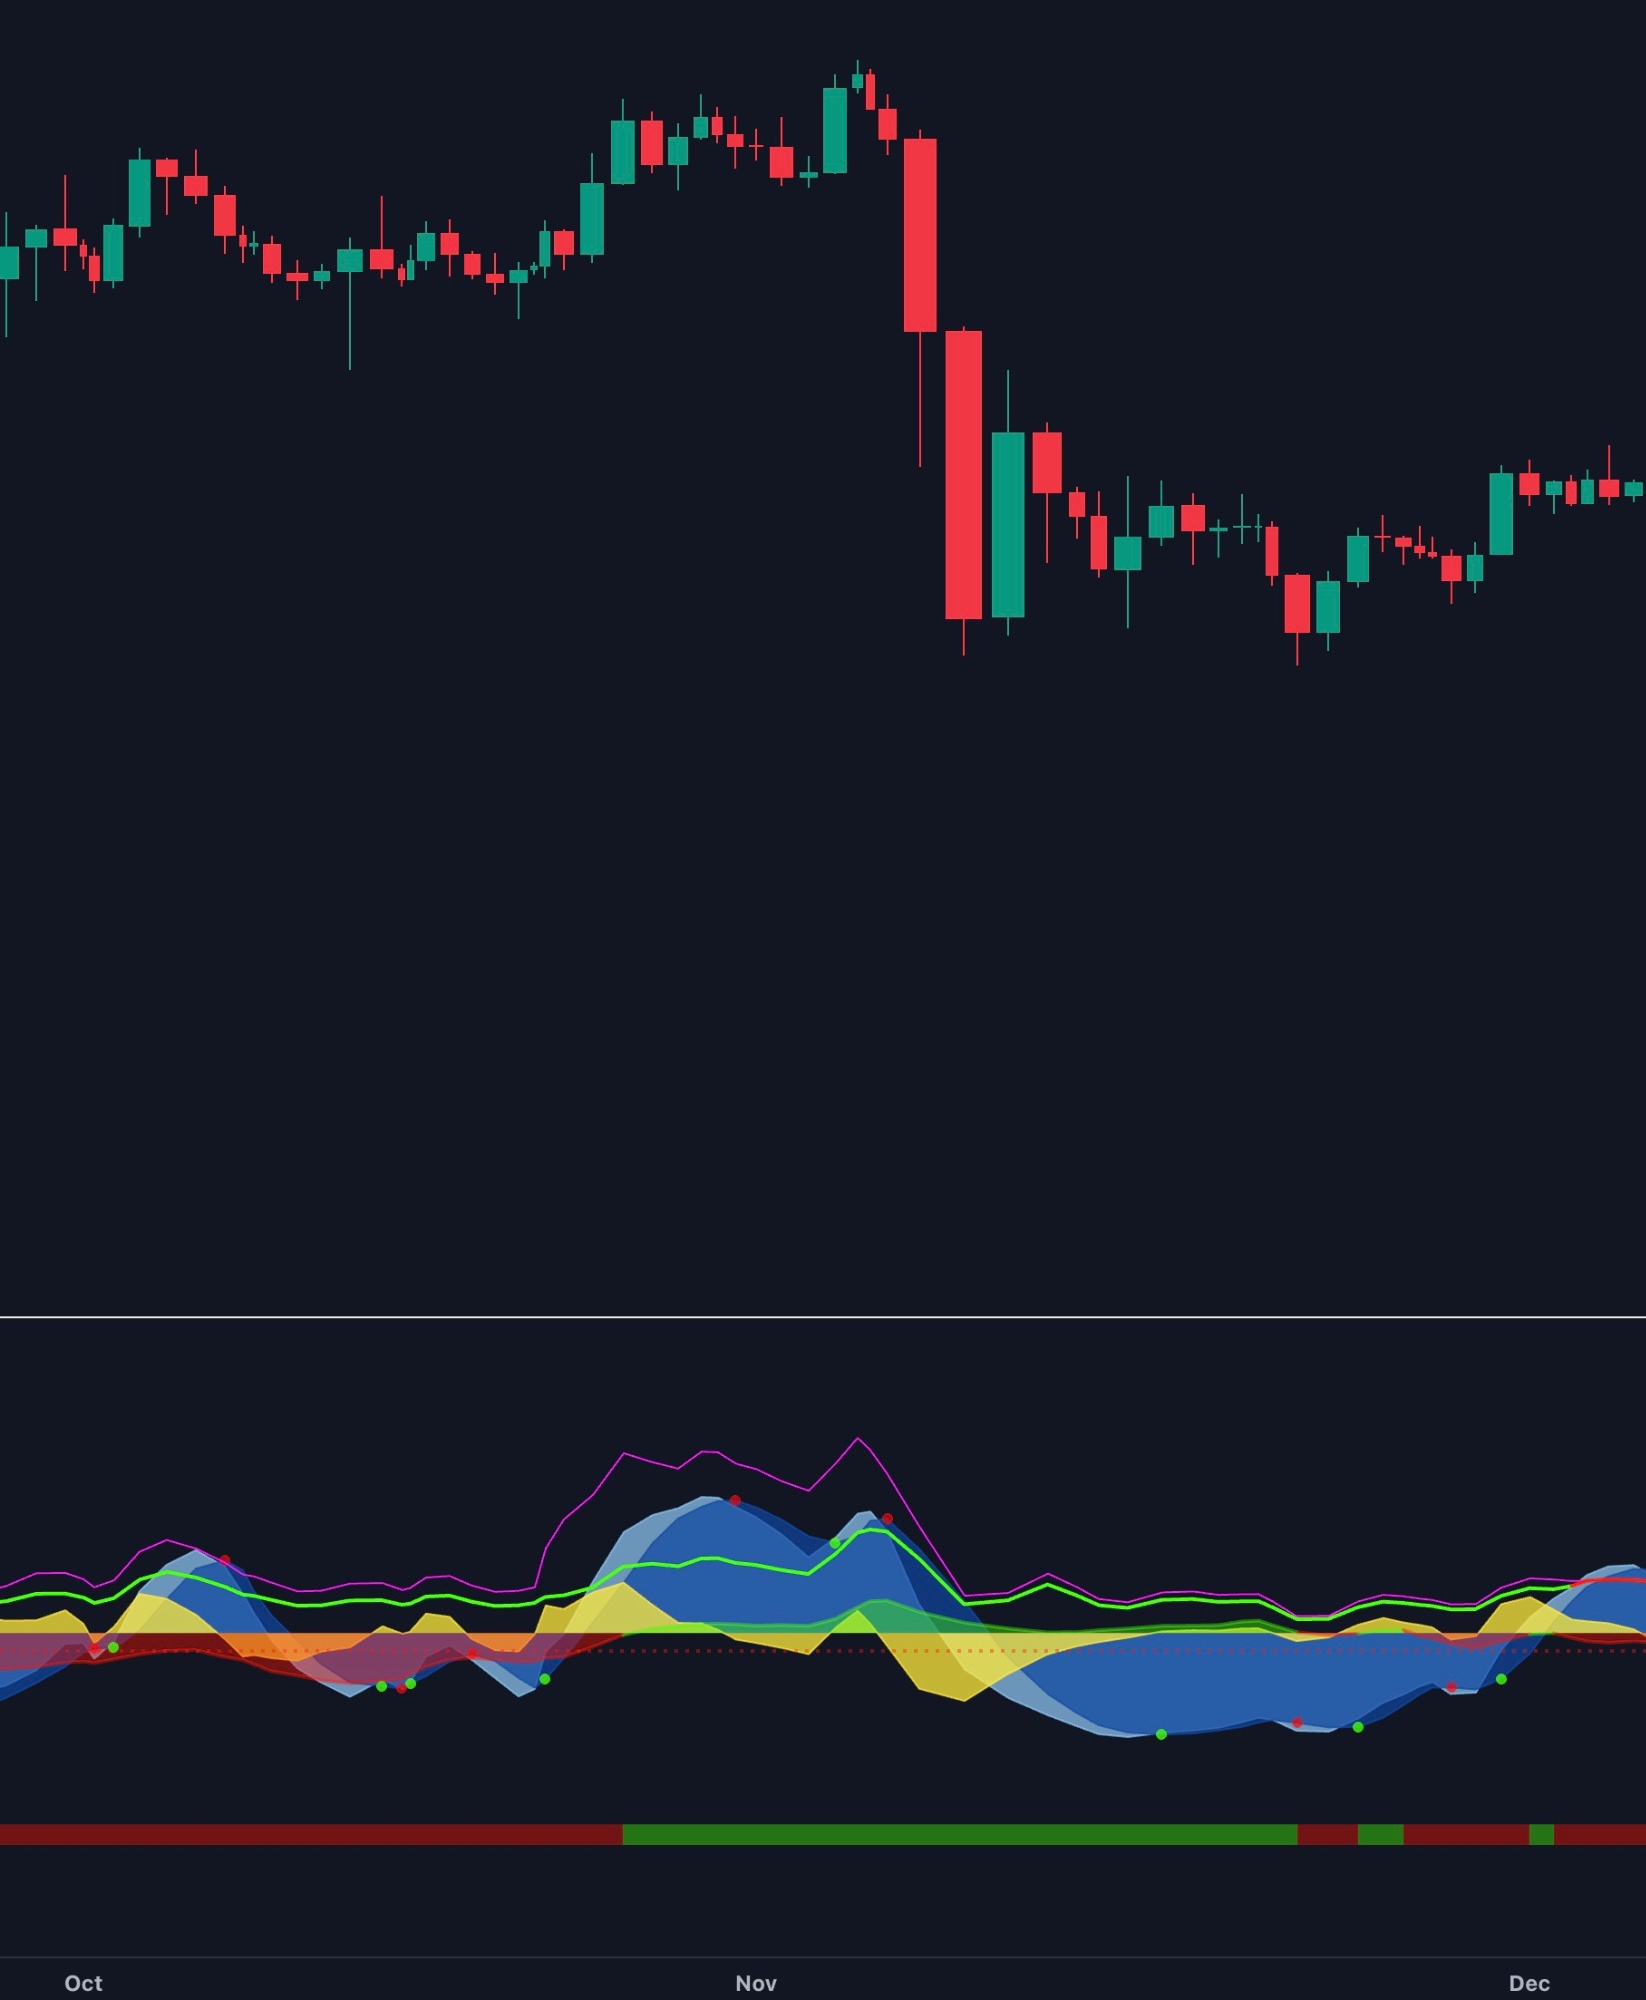
BTC Daily — Oct to Dec 2022 (FTX Crash)
BTC daily chart Oct–Dec 2022 — classic bullish divergence. Price made a new low on the FTX collapse but MCB waves made a higher low, signalling seller exhaustion before the recovery began.
4. VWAP Wave Cross + Green Money Flow Confirmation
When MCB's VWAP oscillator crosses up and the Money Flow Wave flips green in the same window, two independent components are agreeing directionally. This dual confirmation significantly improves the reliability of either signal taken alone. Works in reverse for short entries.
- Best timeframe: 15m to 1H for active swing trade entries
- Strongest when it occurs after a period of red money flow — the flip is more meaningful than a mid-trend cross
- Remember: the VWAP component logic is inverted from traditional VWAP
- Combine with a key horizontal support level for the cleanest version of this setup
VWAP Wave Cross — Three Signals Visible
MCB VWAP wave — three crosses visible showing the inverted logic in action. The yellow line crossing up signals long bias; crossing down signals short/exit. Each cross here preceded the corresponding price move.
5. Stoch RSI Transition on the Weekly (Long-Term Positioning)
On the weekly chart, the Stochastic RSI line can hold a single state for months at a time. When it finally transitions while below the 50 level, that shift often marks the beginning of a new macro momentum phase. This is a position trade and accumulation signal — not for short-term or day trading.
- Enable the Stoch RSI display on the weekly chart and watch for colour/state transitions below the 50 level
- Identifies long-term momentum shifts for Bitcoin and major altcoins
- Pair with your spot buying strategy for scale-in decisions
6. Zero Line Rejection — Continuation in an Uptrend
In a confirmed uptrend, MCB will rarely reach deep oversold. Instead, the momentum waves will pull back toward the zero line and bounce without crossing into negative territory. These zero line rejections are trend-continuation entries — and often the cleanest, lowest-risk longs available in a trending market.
How to Trade It
- Higher-timeframe trend must be clearly bullish — confirmed by EMA structure or MCB daily being positive
- On the 4H: wait for WT1 to approach the zero line, slow, and curl back upward
- Entry on the curl; stop below the recent swing low on the price chart
- Do not wait for oversold in a strong trend — you will miss the best moves if you do
7. Money Flow Peak — Partial Exit Signal
Knowing when to exit is as important as knowing when to enter. When the Money Flow Wave reaches an extreme positive reading far above its normal range after a sustained move, that signals maximum capital inflow — the market is likely being distributed into strength.
- Extreme green peak after a multi-day or multi-week run: consider 33–50% partial profit
- Move stop to breakeven on the remaining position
- Most reliable when a red dot (WT crossing down) coincides with the green peak simultaneously
- Do not exit entirely — the trend may continue; reduce exposure, don't end the trade
Size Every Signal Correctly
Even a Green Dot at extreme oversold can lose money with an oversized position. Use the Position Size Calculator to make sure every MCB signal risks only what you can afford to lose.
Calculate Your Position Size →Multi-Timeframe Strategy
MCB is designed to be used across multiple timeframes — and the real skill lies in knowing how each timeframe's information feeds the next.
| Timeframe | MCB Role | What to Look For |
|---|---|---|
| Weekly | Macro bias | Stoch RSI direction + extreme oversold Green Dot = cycle positioning |
| Daily | Setup identification | Green Dot with divergence = swing trade opportunity; Money Flow trend direction |
| 4H | Entry timing | VWAP cross + Money Flow flip + double-dip confirmation = entry zone |
| 1H – 15m | Precision entry | Zero line rejections + VWAP crosses for intraday refinement |
⚠️ The Cardinal Rule: Never trade against the daily MCB direction on a lower timeframe. If the daily waves are negative and pressing lower, 4H Green Dots are counter-trend trades. You can take them — but they require tighter stops and faster exits. Always align your timeframes first, then time your entry.
What Indicators Work Best With Market Cipher B?
MCB covers momentum, wave trend, money flow, and VWAP — but pairing it with tools from different analytical categories makes for a more complete decision framework.
MCB + EMA Ribbons (Market Cipher A)
Market Cipher A provides an 8-EMA ribbon that turns blue/white in bull conditions and grey in bear conditions. When the EMAs are spread apart and bullish, MCB Green Dot signals carry far more weight than when the ribbons are compressed and grey. This is the native pairing the Market Cipher system was designed around.
MCB + Key Support and Resistance
MCB signals that coincide with significant structural levels are the most reliable setups available. A Green Dot with divergence printing directly at a previous all-time high, a major Fibonacci, or a well-respected moving average is a materially different trade from the same signal appearing mid-range with no structural context.
MCB + Volume Analysis
Volume confirms the conviction behind a move. A bullish MCB signal accompanied by a volume spike of 2–3× average carries significantly more weight than the same signal on below-average volume. Flat or declining volume on an MCB signal is a warning, not a confirmation.
MCB + the Risk Calculator
MCB tells you where to enter and where the signal is valid until. The Advanced Risk Calculator translates that into exact position sizes based on your account size and risk tolerance. These two tools together form the complete loop — signal identification and disciplined execution.
Know Your Numbers Before Every Trade
Use the Advanced Risk Calculator to convert every MCB signal into a properly sized trade. Set your entry, stop, and let the calculator do the rest.
Open the Risk Calculator →Common Mistakes With Market Cipher B
Mistake #1: Treating every Momentum Wave Crossing as a valid entry. The Momentum Wave Crossing (little circle) appears at all WaveTrend wave crossings — no oversold requirement. In a ranging or weakly trending market, these print constantly. They are a directional alert, not a standalone entry signal.
Mistake #2: Entering on the first Green Dot without waiting for confirmation. The first Green Dot at an oversold extreme can print while the market is still mid-capitulation. Waiting for the second wave to form and confirm gives you a tighter stop and better risk/reward. Entering immediately on the first dot is not wrong — but it requires accepting more risk.
Mistake #3: Using traditional VWAP logic on MCB's VWAP wave. The VWAP oscillator in MCB is intentionally inverted from traditional VWAP rules. Cross up = long, cross down = short — the opposite of what experienced VWAP traders are used to. Applying standard rules here means taking the wrong side of every signal.
Mistake #4: Disabling the Stoch RSI component entirely. On shorter timeframes this simplification is reasonable. On the weekly chart, the Stoch RSI transition is a macro-level momentum signal worth keeping enabled even if you only check it once a week.
Mistake #5: Ignoring the Money Flow Wave entirely. Many users focus exclusively on the momentum waves and Green Dots, treating the Money Flow Wave as visual noise. This removes one of MCB's most independent data sources. Even basic awareness of whether money flow is green or red significantly improves signal filtering.
Mistake #6: Relying on guides written for VuManChu Cipher B clones. VuManChu Cipher B is an open-source free clone that implements similar concepts but with different signals and different logic — including the "Golden Circle" at a −75 WaveTrend threshold, which does not exist in the official Market Cipher B from CryptoFace. Many tutorials online conflate the two. Make sure the guide you are reading references marketciphertrading.com, not a free clone.
Quick Reference: MCB Signal Cheat Sheet
| MCB Signal | What It Means | Action to Consider |
|---|---|---|
| Momentum Wave Crossing (little circle) | WT1 crosses WT2 anywhere | Directional alert only — needs significant additional confluence to act on |
| Green Dot (Green Circle) | All five algorithms converge at oversold | Primary buy signal — deeper in oversold = higher quality; wait for double-dip confirmation |
| Green Dot + Divergence (below MFI bar) | Divergence confirmed between WT and RSI/StochRSI | Highest-conviction long — enter on candle close; strongest when Money Flow flipping green |
| Red Dot | WT1 crosses below WT2 at overbought — bearish | Exit signal or bearish bias — confirm with Money Flow direction |
| VWAP wave cross up | Bullish directional bias (inverted from traditional VWAP) | Long bias confirmed — combine with Money Flow flip for best entry |
| VWAP wave cross down | Bearish directional bias | Short bias or exit longs — confirm with Money Flow direction |
| Money Flow extreme green peak | Maximum capital inflow — possible distribution | Consider 33–50% partial profit; move stop to breakeven |
| Money Flow extreme red bottom | Maximum outflow — potential accumulation zone | Watch for Green Dot + divergence; do not enter on money flow alone |
| Stoch RSI transition (weekly) | Macro momentum shifting direction | Long-term accumulation or distribution signal — macro context only |
| Zero line rejection (uptrend) | Pullback absorbed without reaching oversold | Trend continuation long — entry on WT1 curl up from zero line |
Market Cipher B vs VuManChu Cipher B — What's the Difference?
This is one of the most common questions from traders who have researched MCB online. Because VuManChu Cipher B is a free, open-source TradingView indicator that was inspired by Market Cipher B, there is significant overlap in appearance — but also important differences in signals and terminology. Many tutorials online conflate the two.
| Feature | Market Cipher B (Official) | VuManChu Cipher B (Free Clone) |
|---|---|---|
| Cost | Paid subscription — marketciphertrading.com | Free on TradingView (open source) |
| Green Dot | Momentum Green Dot — all five algorithms converge | Green Circle — WaveTrend at oversold, crossed up |
| Golden Circle | Does not exist in official MCB | Present — WaveTrend below −75 or −80 |
| Wave terminology | WT1 (Lt Blue Wave) and WT2 (Blue Wave) | WT1 and WT2 (same concept, same colours) |
| VWAP component | VWAP Momentum Wave (yellow) — inverted logic | Included but implementation may differ |
| RSI colour | Magenta/pink (confirmed in official Style panel) | Purple by default in most versions |
| Anchor/Trigger terminology | Official — documented in MCB guide | Community term, not in official VuManChu docs |
| Sommi Flag / Diamond | Not present in MCB | Present — blue/purple flag signals |
| Source code | Closed source, proprietary | Open source (Pine Script) |
⚠️ Why this matters for guides and tutorials: Because VuManChu is free and open source, the majority of MCB tutorials you find on YouTube, Reddit, and trading forums are actually describing VuManChu's signals using MCB's name. If a guide mentions a "Golden Circle," "Sommi Flag," or gives specific threshold numbers like −75 or −80, it is describing VuManChu — not the official Market Cipher B. Always verify which indicator a tutorial is actually based on before applying its logic to your MCB charts.
Frequently Asked Questions About Market Cipher B
These are the questions traders most commonly ask about Market Cipher B — answered directly based on the official MCB documentation and indicator behaviour.
What is Market Cipher B?
Market Cipher B is a premium all-in-one oscillator indicator available exclusively on TradingView, created by CF Strategies LLC (CryptoFace and FloppingGroper). It combines five fine-tuned algorithms — Momentum Waves, VWAP Momentum Wave, Money Flow Wave, RSI, and Stochastics — into a single pane. When all five algorithms converge, it renders the Momentum Green Dot, its primary buy signal. It is used for crypto, stocks, forex, and commodities across all timeframes.
What does the green dot on Market Cipher B mean?
The green dot on Market Cipher B — officially called the Momentum Green Dot — signals that all five of MCB's internal algorithms have converged simultaneously in oversold territory. According to the official documentation, it "will aid you in longing the dips in bull markets as well as temporarily exiting shorts in bear markets" and "is often accompanied by extreme sellers' momentum." The signal is strongest when the dot prints deep in oversold territory and at a significant support level on the price chart. A green dot appearing below the Money Flow Bar indicates an additional divergence confirmation, making it the highest-quality version of the signal.
Does Market Cipher B have a Golden Circle?
No. The Golden Circle does not exist in the official Market Cipher B from CryptoFace. It is a signal in the free VuManChu Cipher B open-source clone, which triggers when the WaveTrend drops below −75 or −80. Many online guides incorrectly attribute this signal to MCB because VuManChu Cipher B was inspired by Market Cipher and uses similar visuals. The official MCB has the Momentum Green Dot as its primary signal, with quality determined by oversold depth and divergence confirmation — not a separate "golden" tier.
What is the VWAP wave on Market Cipher B and how do you read it?
The VWAP Momentum Wave on Market Cipher B is the yellow line in the indicator pane. It is not the same as the traditional VWAP used for day trading on a price chart. The official MCB documentation explicitly states the logic is inverted from traditional VWAP: when the wave crosses upward, the bias is bullish (long); when it crosses downward, the bias is bearish (short). This is the opposite of standard VWAP rules. The VWAP wave works best on shorter timeframes (15m to 1H) for establishing directional bias, and is most useful when combined with a simultaneous green Money Flow bar.
What is the best timeframe for Market Cipher B?
Market Cipher B works on all timeframes, but each serves a different purpose. The weekly chart is used for macro positioning — watching the Stochastics transition and extreme oversold Green Dots that can signal major cycle lows. The daily chart is best for swing trade setup identification — anchor waves, Green Dots with divergence, and Money Flow direction. The 4H chart is the primary entry timing timeframe — VWAP crosses, Money Flow flips, and trigger wave confirmations. The 1H and 15m are used for precision entry refinement within a trade already identified on higher timeframes. The cardinal rule is never to take a lower-timeframe long signal when the daily MCB waves are trending down.
What are anchor and trigger waves in Market Cipher B?
Anchor and trigger waves are official Market Cipher B terminology, confirmed in the MCB documentation: "This indication is also useful when used as a pivot or anchor point waiting for a trigger wave to form." The anchor is the first Momentum Green Dot that fires when the waves reach deep oversold — it establishes the low and absorbs peak selling pressure, but the market may still be mid-capitulation. The trigger is a second, shallower wave that forms after a minor pullback and then curls upward — this is the confirmation that selling is genuinely exhausted. Entering on the trigger wave rather than the anchor gives a tighter stop and better risk/reward.
What is the difference between Market Cipher B and VuManChu Cipher B?
Market Cipher B is a paid, closed-source proprietary indicator from CF Strategies LLC, available at marketciphertrading.com. VuManChu Cipher B is a free, open-source Pine Script indicator on TradingView that was inspired by Market Cipher and uses similar wave-based concepts. The key differences are: VuManChu has a Golden Circle signal (WaveTrend below −75) which does not exist in official MCB; VuManChu includes Sommi Flag signals which are not in MCB; RSI displays as purple in most VuManChu versions versus magenta in official MCB. Most online tutorials and YouTube guides describing MCB signals are actually describing VuManChu, because it is free and the code is public. Always verify which indicator a guide refers to before applying its rules.
What does the Money Flow bar mean on Market Cipher B?
The Money Flow Bar is the coloured strip at the bottom of the Market Cipher B pane. It is a simplified display of the Money Flow Wave, showing the zero-crossing point more clearly than the wave itself. A green bar means the Money Flow Wave is positive — money is flowing into the market. A red bar means the wave is negative — money is flowing out. It is most useful as a quick confirmation signal: a Green Dot appearing when the Money Flow Bar is already green is a stronger combined signal than a dot appearing against a red bar.
How much does Market Cipher B cost?
Market Cipher B is available through a paid subscription at marketciphertrading.com. The indicator requires an active subscription and your TradingView username to be added to the access list. Pricing options include annual and lifetime plans. Because the indicator is proprietary and closed source, there is no free trial or free version of the official MCB — any free version you find online is a VuManChu clone or other community recreation, not the official indicator.
💡 Trade Logic affiliate link: If you decide to subscribe, using our referral link supports the site at no extra cost to you.
What colours are the lines in Market Cipher B?
Based on the official Market Cipher B Style settings panel: Light blue = WT1 (leading/fast momentum wave); Blue = WT2 (lagging/slow momentum wave); Yellow = VWAP Momentum Wave; Magenta/pink = RSI; Green = Stochastics (bullish state) and Money Flow positive; Red = Stochastics (bearish state) and Money Flow negative; Green dot = Momentum Green Dot buy signal; Red dot = bearish wave crossing. Note that the purple line visible in some MCB charts is the RSI — it appears magenta in the settings but can look purple depending on chart background.
What is the JTTW pattern in Market Cipher?
JTTW stands for "Jesus Take the Wheel" — a catchphrase used by CryptoFace (one of MCB's creators) on livestreams and social media when he identifies an extreme oversold setup that he considers exceptionally high conviction. It is not a formally documented pattern with specific defined conditions in the MCB guide. In practice, it refers to a scenario where the Momentum Green Dot fires at deep oversold on a significant higher-timeframe support level — essentially the highest-conviction version of Setup #1 in this guide. Treat it as a community label for an extreme version of the standard green dot signal rather than a separate technical setup.
Ready to Trade With Market Cipher B?
This guide took dozens of hours to research and write. If it helped you, the best way to support Trade Logic is to subscribe through our referral link — you pay exactly the same price, and it helps us keep producing free content like this.
Get Market Cipher B →Affiliate link — same price for you. Trade Logic is not affiliated with CF Strategies LLC.
The Bottom Line
Market Cipher B is five fine-tuned algorithms unified into a system where confluence does the filtering. The Green Dot that prints when all five agree is far more meaningful than any one of those five signalling in isolation. That is the core design principle — and it is what makes MCB worth learning properly rather than at surface level.
The key discipline is knowing the signal hierarchy: a little circle is an alert, a Green Dot is a signal, a Green Dot with divergence is the highest-quality version of that signal. Quality scales with depth of oversold and number of components agreeing. Apply that hierarchy to position sizing and you are already trading it better than most users.
If you are reading guides that mention a "Golden Circle" — that is the VuManChu Cipher B clone, not the official Market Cipher B from CryptoFace. Always verify which indicator a tutorial is actually describing before applying its logic.
Use MCB as a filter and a timing tool. Combine it with structured trade setups, proper risk management, and a strategy tracker to measure whether your edge is actually delivering over time. That is how you trade it properly.
Track Every MCB Trade You Take
The only way to know if a signal is actually working for you is to log the trades and review the data. The Strategy Tracker does exactly that.
Open the Strategy Tracker →
I started trading Bitcoin in 2019 and learned most of what matters the hard way — through leverage mistakes, bad position sizing, and following the wrong people. After finding my feet with proper risk management, I built Trade Logic to share the frameworks and tools I actually use: a bias dashboard, position size calculator, and signal aggregator, all built around one principle — define the risk before you enter.