Most indicators answer one question. The Jewel answers four simultaneously — and then tells you when all four are saying the same thing at the same time. That convergence is the entire point of the system, and it is what separates the trades that merely look good from the ones that carry genuine structural edge.
The Jewel is a TradingView invite-only indicator originally built and taught by Eric Krown, better known as Krown of Krown's Crypto Cave. The indicator has since been acquired by Meta Signals (metasignals.io), who now own and distribute it. Meta Signals run their entire algorithmic trading alert service on top of The Jewel's data — making it the backbone of what is considered one of the most analytically rigorous crypto signal platforms available. Access to The Jewel is now purchased through Whop. When you subscribe, you receive the TradingView indicator access along with video tutorials from both Eric Krown and The Jewel's original developer.
Rather than shipping a single all-in-one oscillator, the system comprises four distinct proprietary tools — each measuring a different dimension of market behaviour — unified into a framework where confluence does the filtering. When all four layers align, you have The Jewel. When fewer align, you have a lower-quality signal. That hierarchy shapes everything about how the system is traded.
This guide covers every component, how each one is read on its own, how they interact as a system, and the setups — including the advanced ones the community rarely documents — that produce the highest-probability results.

The Jewel combines four proprietary oscillators into a single convergence framework — Image: Pexels
Reading The Chart: What Every Line Means
The Jewel by Meta Signals is a single indicator pane that combines multiple oscillators, an auto-Fibonacci overlay, an EMA cross signal, and optional DMI components — all within one script. Here is the actual indicator running on a live chart, with every element identified from the official Style and Inputs settings panels.
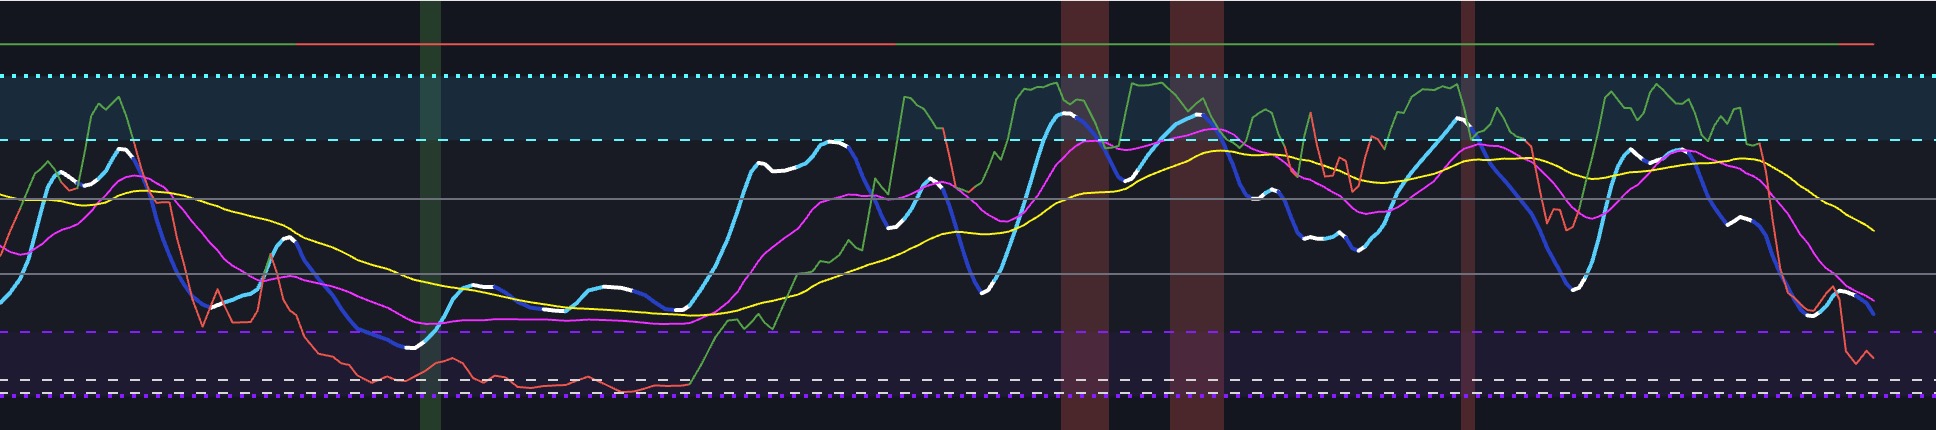
▲ The Jewel by Meta Signals — Complete Line & Level Reference
Settings note: DI−, DI+, and ADX lines are unchecked by default in the Style panel — enable them to display the DMI components on the chart. The EMA Cross defaults to a 21 / 55 EMA pair, adjustable in Inputs. The TimeFrame Multiplier allows you to run the oscillator on a higher timeframe than the current chart.
What Is The Jewel?
The Jewel is a single TradingView indicator pane — officially titled "The Jewel by Meta Signals" — that combines multiple oscillator signals, an auto-Fibonacci overlay, an EMA cross display, and optional DMI components all into one script. Eric Krown originally developed the underlying components, and Meta Signals has since acquired and further developed the indicator, adding the GodModAlert system and additional refinements. Access is now distributed through their platform.
The indicator contains these core elements, all visible within a single chart pane:
- Fast oscillator — the primary momentum line (cyan/blue/white, colour changes with condition); the main signal line
- Slow oscillator — the slower signal line (magenta/pink); Fast crossing above Slow = bullish, below = bearish
- High signal — the slowest macro trend line (yellow); the structural "Yellow Perfection" level
- AutoFib — dynamically calculated Fibonacci reference lines within the oscillator (green and red/orange); the bounce levels
- EMA Cross — 21/55 EMA crossover displayed at the top of the pane (green = bullish, red = bearish) as a trend direction filter
- GodModAlert — background bar alerts (dark green/dark red) that fire when high-confluence internal conditions align
- DMI / DI+ / DI− / ADX — optional directional movement lines, unchecked and hidden by default, enabled in the Style settings
Fixed horizontal levels frame the oscillator: Line Top (100, cyan dotted), Line Limit Up (80, cyan dashed), Line 61.8 and Line 38.2 (grey Fibonacci levels), Line Limit Down (20, purple dashed), and Line Bottom (0, purple dotted). The 20 and 80 thresholds are the primary oversold and overbought zones. The 38.2 and 61.8 grey lines are the internal Fibonacci reference levels — these are the "silver lines" Krown described in the original bounce setup.
The Name Explained: "The Jewel" refers to the convergence event — when the Fast oscillator bounces off the AutoFib levels, the Slow and High lines are aligned, the EMA Cross confirms trend direction, and the GodModAlert fires simultaneously. Finding that moment is the goal. It does not happen on every candle, and that scarcity is precisely what gives it value. Acting on signals where only one component is moving is where most users lose the edge the system is designed to provide.
The Three Signal Lines — Fast, Slow, and High
Everything in The Jewel flows from the relationship between three oscillator lines. Understanding what each line represents and how they interact with each other and with the fixed levels is the entire foundation of reading the indicator.
Fast (Blue / Cyan) — The Primary Signal Line
The Fast line is the most sensitive of the three and the one you watch most closely for entry signals. It is rendered in cyan when in its standard bullish state, shifting through blue and white depending on market conditions. In the official Meta Signals documentation, this line is simply referred to as "Blue."
- The Fast line below 40 — you are in the potential long entry zone
- The Fast line above 40 but rising — you are in the "hold your longs" or add-to-position zone
- The Fast line above 80 — overbought; start looking for exits, not entries
- Fast increasing vs the prior bar — momentum is building in the bullish direction
- Fast decreasing vs the prior bar — momentum is fading; wait or prepare to exit
The 40 Level Is Critical: 40 is not shown as a named level in the settings panel but it is the most operationally important threshold in the indicator. Below 40 is the initial entry zone for longs — where the system looks for its buy signals. Above 40 is the continuation zone — where you hold or add to winning longs. The official Meta Signals signal cards explicitly state "Blue well above 40 (not initial long signal)" to distinguish between entry signals and hold signals. Do not enter new longs when Fast is already well above 40; that moment has passed.
Slow (Pink / Magenta) — The Confirmation Line
The Slow line is a smoothed, slower-reacting version of the same underlying calculation. It acts as the confirmation and filter for Fast line signals. The relationship between Fast and Slow is the primary signal generator in the indicator.
- Fast above Slow — bullish; the fast-moving signal has crossed above the slower line
- Fast below Slow — bearish; downside momentum has taken over
- For an initial long signal: both Fast AND Slow should be below 40 — the lower the better
- Slow also increasing vs prior bar — bonus confirmation; Pink rising alongside Blue strengthens the signal
- Slow still declining while Fast is rising — early-stage signal only; wait for Slow to confirm
High (Yellow) — The Macro Trend Anchor
The High line is the slowest of the three and acts as the macro trend anchor. Its position relative to Fast and Slow defines which type of signal you are reading and what you can do with it.
- Fast > Slow > Yellow, all rising — "Hold Your Longs" signal: this is a trend continuation add setup, not a new entry
- Yellow NOT below Fast and Slow — this is the condition for a Secondary Type long signal (Yellow is above them, meaning the macro trend is still elevated; you are buying a short-term dip within a larger structure)
- Yellow below Fast and Slow — the macro trend line has fully turned down with the other two, which affects how the signal is interpreted
- Yellow acting as visible support below Fast and Slow — the "Yellow Perfection" convergence setup
The Official Signal Types — Defined by Meta Signals
Meta Signals publishes specific, named signal types with precise conditions for each. These are not interpretations — they are the documented logic the platform uses to generate its alerts. Understanding each signal type tells you exactly what you are looking at when the indicator shows a particular pattern.
The Primary Long Signal (Initial Entry)
This is the core long entry signal. It requires:
Primary Long — Required Conditions
- Fast (Blue) is greater than Slow (Pink)
- Both Fast and Slow are below 40 — the lower the better; deeper oversold = higher quality
- Fast is increasing vs the prior bar — momentum must be turning upward
This is the initial entry signal — the moment the system identifies that a low has potentially formed and upside momentum is beginning. "Both less than 40 — lower is better" means a signal at 15 is more compelling than one at 38.
The Secondary Type Long Signal
A valid long entry with slightly different conditions — particularly regarding the Yellow (High) line. The Secondary Type occurs when the macro trend (Yellow) has not yet fully confirmed the move, making it a lower-conviction entry that requires more supporting evidence:
Secondary Long — Required Conditions
- Fast (Blue) is greater than Slow (Pink)
- Both Fast and Slow are below 40
- Yellow (High) is NOT less than Fast and Slow — Yellow is still above them (macro trend elevated)
- Fast is increasing vs the prior bar
- DMI support present (green DMI line active in background) — this is a required filter, not optional
Bonus confirmations that upgrade quality: Slow (Pink) also increasing vs prior bar; GodModAlert green flash ("God Mode") also firing simultaneously.
⚠️ Secondary Type Requires DMI: Unlike the Primary signal, the Secondary Type specifically requires DMI support — the green DMI line must be active in the background. This is not a bonus; it is a stated condition. Enabling the DMI lines in the Style settings and checking for DMI support before acting on a Secondary Type signal is essential.
The "Hold Your Longs" Signal (Trend Continuation)
This is not an entry signal — it is an instruction to maintain or add to an existing long position. Confusing it with an entry is one of the most common mistakes Jewel users make:
Hold Your Longs — Required Conditions
- Fast (Blue) > Slow (Pink) > Yellow (High) — all three lines in descending order with Fast on top
- All three increasing vs the prior bar
- Fast well above 40 — explicitly stated as "not initial long signal"
This pattern confirms the uptrend is intact and momentum is strong across all three signal lines. The appropriate response is to hold existing long positions and consider adding to them — not to open new initial entries at this elevated level.
The GodModAlert — Highest Confluence
The GodModAlert (referred to as "God Mode" in Meta Signals materials) is the background bar system that fires when the indicator's internal algorithms detect maximum bullish or bearish confluence. A green background bar is the "God Mode" bullish flash — when this appears alongside a Primary or Secondary long signal, it is the bonus confirmation that upgrades any setup to its highest quality version.
- God Mode green flash appearing alongside a Primary long: highest-conviction long setup the indicator generates
- God Mode appearing alongside a Secondary long: significantly upgrades the quality of what is otherwise a lower-confidence signal
- God Mode alone, without Fast/Slow signal alignment: do not act on the bar alone — it needs the line conditions to be met
The Signal Hierarchy — Quality Tiers
Not all Jewel signals are equal. Here is how to rank them from lowest to highest conviction, based on the official Meta Signals signal framework:
| Signal Type | Core Condition | Quality / Use |
|---|---|---|
| Fast > Slow (above 40) | Lines are bullish but not in the entry zone | Hold existing longs — not a new entry |
| Secondary Long | Fast > Slow, both < 40, Yellow NOT below them, DMI support | Medium — valid entry, requires DMI filter; God Mode bonus upgrades it |
| Primary Long | Fast > Slow, both < 40, Fast increasing | High — core entry signal; deeper below 40 = higher quality |
| Primary Long + God Mode | All Primary conditions + GodModAlert green bar | Highest — maximum convergence, fullest conviction |
| "Hold Your Longs" | Fast > Slow > Yellow, all rising, Fast well above 40 | Not an entry — add to / hold existing long position |
The AutoFib Lines — Dynamic Support and Resistance
The AutoFib component (enabled via "Show AutoFib" in Inputs) overlays dynamically calculated Fibonacci levels within the oscillator pane. These are the green and red/orange jagged lines visible on the chart — they recalculate based on recent swing highs and lows rather than being fixed like the horizontal level lines.
- Green AutoFib line — acts as a dynamic support level within the oscillator; when the Fast line pulls back to touch this and bounces, it is a signal that the current move has absorbed selling and is ready to resume
- Red/orange AutoFib line — acts as dynamic resistance; the Fast line stalling or reversing at this level warns that upside momentum may be exhausting
- The AutoFib levels shift as new price data arrives — they are not fixed horizontal lines
- The original Krown description of "light blue bouncing off the dark pink and silver lines" refers to the Fast line bouncing off these AutoFib levels — the visual colour of those levels in the original indicator was dark pink and silver, which in the Meta Signals version appears as green and red/orange
The EMA Cross — Built-in Trend Filter
The EMA Cross component (enabled via "Show EMA Cross" in Inputs) displays a 21-period and 55-period EMA crossover signal at the top of the indicator pane, positioned above the oscillator range (at level 110 by default). It acts as a built-in trend direction filter so you do not need to add EMAs to your price chart separately.
- Green EMA Cross — 21 EMA is above 55 EMA; the medium-term trend is bullish; favour long signals from the oscillator
- Red EMA Cross — 21 EMA is below 55 EMA; bearish trend; avoid new longs until this flips
- Can be switched from EMA to MA cross via the "Use MA Cross Instead of EMA" Inputs setting
- The EMA periods (21 and 55) and the line position are adjustable in Inputs
- A TimeFrame Multiplier is available in Inputs to run the EMA cross on a higher timeframe than the chart — useful for getting a daily EMA read while on a 4H chart
Practical Use: Before taking any long signal from the oscillator, glance at the EMA Cross at the top of the pane. If it is red, the medium-term trend is against you and the long signal is counter-trend. Either wait for the EMA Cross to turn green, apply a tighter stop, or skip the trade entirely. This is the cleanest one-glance trend filter available within the indicator itself.
The 6 Best Setups Using The Jewel
These setups are built directly from the official Meta Signals signal framework — using the named signal types and the exact conditions they define.
1. Primary Long at Deep Oversold (Highest Conviction Entry)
The cleanest long entry the indicator generates. Fast > Slow, both well below 40 (ideally below 20), Fast increasing. The further below 40 both lines are, the higher the quality.
How to Trade It
- Fast must be greater than Slow — wait for this cross to confirm before entering
- Both lines should be below 40; below 20 is ideal; near 0 is the highest-conviction version
- Fast must be increasing vs the previous bar — do not enter on a flat or declining Fast line
- Check EMA Cross at top of pane — if green, the trade is with the medium-term trend
- If GodModAlert green bar fires simultaneously, this is the maximum quality version of the setup
- Stop: below the candle where Fast made its low; target: Fast reaching 80 level for partial, full exit on red signal
2. Secondary Long with DMI Support
A valid long entry when Yellow has not yet fully confirmed the move — meaning Yellow is still above both Fast and Slow. Requires DMI support as a mandatory filter.
- Fast > Slow, both below 40, Fast increasing — same as primary
- Yellow must NOT be below Fast and Slow — if Yellow has already dropped below them, this becomes a Primary signal, not Secondary
- Enable DMI lines in Style settings and confirm the green DI+ line is present in the background
- Treat with slightly smaller initial size than a Primary — confirm Slow is also increasing as a bonus before committing full position
- God Mode flash appearing here significantly upgrades confidence
3. Primary Long + God Mode (Maximum Confluence)
When the Primary long conditions and the GodModAlert green bar fire on the same candle or within one bar, you have the indicator's highest-quality signal. This is the convergence the system is designed to find.
How to Trade It
- All Primary conditions met: Fast > Slow, both < 40, Fast increasing
- GodModAlert green background bar present on the same candle
- EMA Cross green at the top of the pane — trend alignment confirmed
- This is the setup that warrants maximum position size within your risk parameters
- Use the Position Size Calculator — even the highest-quality signal requires disciplined sizing
4. "Hold Your Longs" — Adding to a Winning Position
Not an entry — a position management signal. When Fast > Slow > Yellow and all three are rising with Fast well above 40, the indicator is confirming the uptrend is intact and momentum is broadening. The correct response is to hold existing longs and consider scaling in if your risk parameters allow.
- Do not open a new initial long here — you are above the entry zone
- Review your open position: is your stop still appropriately placed?
- Consider adding a partial position with a tighter stop (e.g., below the most recent swing low) if the EMA Cross is green
- This signal appearing repeatedly in succession means the trend is strong — trail your stop rather than exiting prematurely
5. AutoFib Bounce Within a Confirmed Trend
In an established uptrend (EMA Cross green, Fast > Slow above 40), price will periodically pull back. When the Fast line dips toward the green AutoFib support level and bounces without breaking below it, that is a trend-continuation long opportunity.
- Trend must already be confirmed — EMA Cross green, recent Primary long signal in history
- Fast pulls back toward but does not cross below the green AutoFib line
- Fast starts increasing vs prior bar at or near the AutoFib support
- This is a re-entry or add setup, not an initial long — size accordingly
- Target: Fast resuming its move toward the 80 level; stop below the AutoFib support
6. EMA Cross Flip — Trend Direction Change
When the EMA Cross at the top of the pane flips from red to green, the medium-term trend bias has shifted bullish. This is a macro directional change signal — particularly powerful when a Primary long signal from the oscillator fires simultaneously or within a few bars of the EMA Cross flip.
- EMA Cross flips green for the first time after a sustained red period
- Watch for a Primary long signal firing within the same session or the next few bars
- This combination — EMA Cross flip + Primary long — is one of the highest-quality swing trade entry setups in the system
- DMI lines if enabled should show DI+ crossing above DI− to further confirm the directional change
Size Every Signal Correctly
Even a Primary Long + God Mode setup can lose money with an oversized position. Use the Position Size Calculator to make every trade risk only what you can afford.
Calculate Your Position Size →Multi-Timeframe Strategy
The Jewel's TimeFrame Multiplier in the Inputs settings means you can run the oscillator calculation on a higher timeframe than your current chart — a significant advantage for multi-timeframe analysis. Here is how to stack timeframes effectively:
| Timeframe | Primary Role | What to Look For |
|---|---|---|
| Weekly / Daily | Macro bias and cycle positioning | EMA Cross direction; are Fast/Slow near 0–20? That is cycle-level oversold |
| Daily | Swing trade setup identification | Primary Long signals with God Mode; "Hold Your Longs" for trend continuation |
| 4H | Entry timing within daily trend | Secondary Long with DMI support; AutoFib bounces within confirmed uptrend |
| 2H / 1H | Scalp entries and precise timing | Primary Long setups; EMA Cross flips; use TimeFrame Multiplier to pull higher TF data |
⚠️ Timeframe and Signal Quality: The original Krown release notes specified that the indicator had only been tested on the 1H and 2H for short-term trades, with lower timeframes producing unreliable results. While Meta Signals' current version may behave differently, using the indicator on 15-minute or 5-minute charts without extensive personal backtesting is not recommended. Stick to 1H and above until you have verified performance on your specific setup.
What Indicators Work Best With The Jewel?
The Jewel already contains an EMA cross and optional DMI — so it covers trend direction and directional strength internally. The most valuable external additions are price structure tools and volume confirmation.
The Jewel + Key Support and Resistance
A Primary Long signal firing at a significant price-level support — a previous all-time high, a major weekly close, a well-tested moving average — is a materially better trade than the same signal mid-range with no structural context. The indicator measures momentum conditions; it does not know where price is on the chart. Always map your structural levels before evaluating Jewel signals.
The Jewel + Volume
A Primary Long signal with a volume spike on the signal candle (2–3× average) is significantly more reliable than the same signal on flat or declining volume. Volume confirms that the directional move has market participation behind it. Check the volume profile before committing to full size on any signal.
The Jewel + Higher Timeframe Jewel (TimeFrame Multiplier)
Use the built-in TimeFrame Multiplier in Inputs to run a second Jewel instance at a higher timeframe on the same chart. If the 4H Jewel shows a Primary Long at the same time the 1H Jewel fires, the two timeframes are aligned — a significantly higher-quality setup than a signal on only one timeframe.
The Jewel + The Risk Calculator
The Jewel tells you where the signal is valid and at what point it has failed. The Advanced Risk Calculator converts that into a properly sized position based on your account and risk tolerance. These two tools together close the loop between signal identification and disciplined execution.
Define Your Risk Before Every Entry
The Advanced Risk Calculator turns your entry, stop, and account size into an exact position size — for every trade, every time.
Open the Risk Calculator →Common Mistakes With The Jewel
Mistake #1: Entering a new long when Fast is well above 40. This is the most important operational mistake. The official Meta Signals documentation is explicit: Fast well above 40 is a "Hold Your Longs" signal, not an initial entry signal. Opening a new long when the oscillator is already elevated means buying into strength rather than buying at a low — the entire opposite of what the signal system is designed for.
Mistake #2: Taking a Secondary Long without DMI support. The Secondary Type signal has DMI support listed as a required condition, not a bonus. If the DMI lines are not enabled in your Style settings, you cannot properly filter Secondary signals. Enable DI+ and DI− in the Style panel so you can see when DMI support is present.
Mistake #3: Treating a God Mode bar as a standalone signal. The GodModAlert background bar is a bonus confirmation — it upgrades an already-valid signal. A God Mode bar appearing when Fast and Slow are not in the correct position (both below 40, Fast above Slow) does not generate a tradeable entry on its own. Always check the line conditions first.
Mistake #4: Ignoring the EMA Cross direction. The built-in EMA Cross (21/55) at the top of the pane tells you the medium-term trend bias at a glance. Taking Primary Long signals when the EMA Cross is red means trading against the trend. At minimum, reduce size and tighten stops when the EMA Cross is not confirming your signal direction.
Mistake #5: Treating "lower is better" as binary. The signal condition "both less than 40 — lower is better" is a quality gradient. A Primary Long with both lines at 5 is not the same as one with both at 38 — the former is a far more oversold condition and historically produces larger bounces. Not all Primary Longs are created equal; depth of oversold matters.
Mistake #6: Not using the TimeFrame Multiplier. Many users run The Jewel on a single timeframe and miss the built-in tool for multi-timeframe confluence. Setting a second chart with the TimeFrame Multiplier at 4 on a 1H chart gives you a 4H Jewel reading without leaving the chart. When both timeframes show a Primary Long simultaneously, the setup quality is materially higher.
Quick Reference: The Jewel Signal Cheat Sheet
| Signal / Pattern | Conditions | Action |
|---|---|---|
| Primary Long | Fast > Slow, both < 40, Fast increasing — lower is better | Long entry — core signal; deeper oversold = higher quality |
| Primary Long + God Mode | Primary conditions + GodModAlert green bar firing | Highest-conviction long — maximum size within your risk limits |
| Secondary Long | Fast > Slow, both < 40, Yellow NOT below them, Fast increasing, DMI support present | Long entry — requires DMI filter; God Mode and Pink increasing are quality bonuses |
| Hold Your Longs | Fast > Slow > Yellow, all increasing, Fast well above 40 | NOT a new entry — hold or add to existing long position only |
| AutoFib bounce | Fast pulls back to green AutoFib support and turns up within uptrend | Re-entry or add — trend continuation; confirm EMA Cross is green |
| EMA Cross flip (red → green) | 21 EMA crosses above 55 EMA at top of pane | Trend has turned bullish — watch for first Primary Long signal as entry |
| Fast above 80 | Fast in overbought zone (above Line Limit Up) | Start preparing exits — not the zone for new longs |
| God Mode red bar | GodModAlert bearish — multiple conditions signalling downside | Exit existing longs or wait for full reset before re-entering |
| EMA Cross flip (green → red) | 21 EMA crosses below 55 EMA — bearish trend shift | Avoid new longs; tighten stops on existing; wait for flip back to green |
Setting Up The Jewel on TradingView
The Jewel by Meta Signals is an invite-only TradingView script. Access is available through Meta Signals at metasignals.io/jewel — purchasing through their platform gives you TradingView script access, video tutorials, and access to their Discord community where signal questions are answered by the team.
Once your TradingView account has been granted access, add it from your Invite-Only Scripts section in the TradingView Indicators panel. Key setup steps:
- Open the Inputs tab: enable AutoFib, EMA Cross, and Show BG Alerts (GodModAlert) — these are on by default. Check "Use Candle Close instead of Average" is ticked (default). Set your TimeFrame Multiplier if you want higher-timeframe data.
- Open the Style tab: enable DI−, DI+, and ADX if you want the DMI filter visible on-chart for filtering Secondary Long signals.
- The default EMA settings (Short: 21, Long: 55) are the recommended starting configuration. Only adjust after you have observed baseline behaviour.
- Run the indicator as a separate pane below your price chart so the oscillator levels are clearly visible and not overlapping price action.
Track Every Jewel Trade You Take
Log every signal type, quality tier, and outcome. The only way to know which setups are working for you — Primary vs Secondary, with or without God Mode — is to measure it. The Strategy Tracker is built for exactly this.
Open the Strategy Tracker →The Jewel vs Other Indicators — How It Compares
Traders often ask how The Jewel compares to Market Cipher B, the standard Stochastic RSI, or other popular oscillators. Here is a direct comparison across the most relevant dimensions.
| Feature | The Jewel (Meta Signals) | Market Cipher B | Standard Stoch RSI |
|---|---|---|---|
| Signal lines | Fast, Slow, High (three lines) | WT1 (light blue), WT2 (blue) | %K and %D (two lines) |
| Primary buy signal | Primary Long — Fast > Slow, both below 40, Fast increasing | Momentum Green Dot — all five algorithms converge | %K crosses %D in oversold |
| Trend filter built in | Yes — EMA Cross (21/55) and High line | Partial — VWAP wave for direction | No |
| Fibonacci levels | Yes — AutoFib dynamic support/resistance | No | No |
| God Mode / confluence alert | Yes — GodModAlert (green bars) | Green Dot + Divergence (below MFI bar) | No |
| DMI/ADX integration | Optional — required for Secondary Long signals | No | No |
| Named signal types | Primary Long, Secondary Long, Hold Your Longs — officially defined | Green Dot, Anchor, Trigger — officially defined | No named signal types |
| Key entry threshold | 40 level — below = entry zone, above = hold zone | Zero line — above = bullish bias | 20/80 overbought/oversold |
| Access | Paid — via Whop (metasignals.io/jewel) | Paid — marketciphertrading.com | Free — built into TradingView |
Can you use The Jewel and Market Cipher B together? Yes — and many traders do. The Jewel's named signal types (Primary Long, Secondary Long) provide a clear entry framework, while MCB's Money Flow Wave and Momentum Green Dot add independent confirmation from a different algorithmic approach. When both indicators agree on a signal simultaneously, it represents cross-system confluence that neither provides alone.
Frequently Asked Questions About The Jewel
These are the most common questions traders ask about The Jewel indicator — answered directly using the official Meta Signals signal definitions and documentation.
The Bottom Line
The Jewel by Meta Signals is built around one central discipline: only act when the conditions are specifically met, and know exactly which signal type you are looking at. A Primary Long below 40 with God Mode firing is not the same as a "Hold Your Longs" pattern at 60 — treating them identically is the fastest way to trade the indicator incorrectly.
The signal framework is precise. Fast > Slow, both below 40, Fast increasing — that is your long entry. Fast well above 40 with all three lines rising — that is your hold and add signal, not a new entry. Secondary signals need DMI support. God Mode upgrades everything it accompanies. The EMA Cross tells you whether the trade is with or against the medium-term trend. None of this is ambiguous once you understand the named signal types.
Use the risk management framework to define your stop before every entry, the Position Size Calculator to size every trade correctly, and the Strategy Tracker to measure which signal types are actually delivering for you. That combination — precise signal reading, disciplined sizing, and performance tracking — is how a powerful indicator becomes a repeatable edge.

I started trading Bitcoin in 2019 and learned most of what matters the hard way — through leverage mistakes, bad position sizing, and following the wrong people. After finding my feet with proper risk management, I built Trade Logic to share the frameworks and tools I actually use: a bias dashboard, position size calculator, and signal aggregator, all built around one principle — define the risk before you enter.