Why You Should Build a TradingView Strategy & How to Do It
A complete beginner's guide to creating your first automated trading strategy using Pine Script
You've spent countless hours staring at charts, manually watching for your entry signals, and missing trades because you blinked at the wrong moment. There's a better way. Building your own TradingView strategy isn't just for professional programmers—it's one of the most powerful skills any serious trader can develop, and it's far easier than you think.
Whether you're trading Bitcoin, stocks, or forex, automating your trading logic transforms you from a reactive trader into a systematic one. Instead of emotional decisions and missed opportunities, you get consistent execution, comprehensive backtesting, and the ability to trade 24/7 without being glued to your screen.
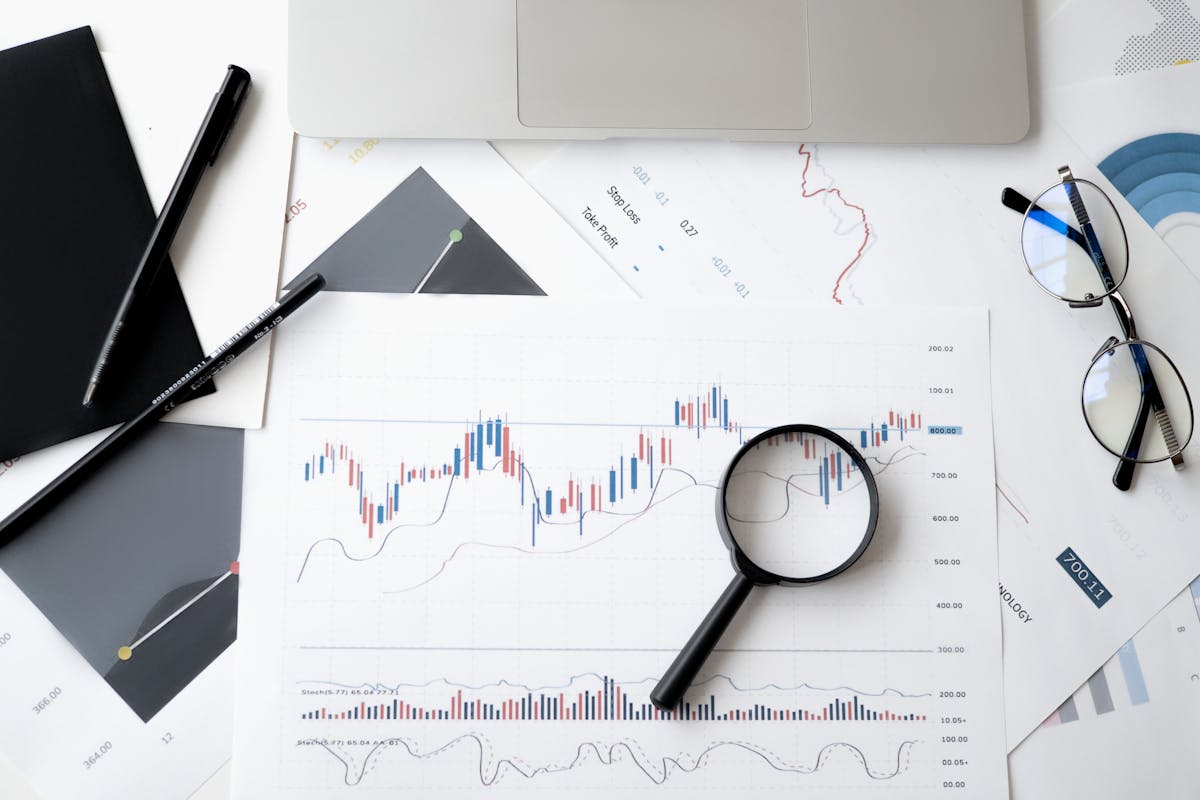
Building your own trading strategy puts you in control of your trading edge
Why Building Your Own TradingView Strategy Changes Everything
Before diving into the how, let's address the why. Understanding the transformative power of custom trading strategies will motivate you through the learning curve ahead.
The Real Advantages of Custom Strategies
Test Before You Trade
Backtest your strategy on years of historical data in seconds. No more wondering "would this have worked?" You'll know exactly how your strategy performed through bull markets, bear markets, and sideways chop.
Eliminate Emotion
Fear and greed destroy accounts. A coded strategy executes your rules perfectly every single time—no hesitation, no revenge trading, no "this time is different" exceptions that blow up your account.
Trade While You Sleep
Crypto markets never close. Your strategy watches 24/7, catching opportunities at 3 AM that you'd otherwise miss. Stop sacrificing your sleep and sanity to monitor charts.
Optimize Systematically
Which moving average period works best? Should you use a 2% or 3% stop loss? Testing manually would take months. With a strategy, you can test hundreds of variations in minutes.
Quantify Your Edge
Get hard numbers on your win rate, profit factor, maximum drawdown, and risk-adjusted returns. Know exactly what you're getting into before risking real capital.
Iterate Rapidly
Had a losing week? Test modifications immediately. See if adding a volume filter or tighter stops would help. Continuous improvement becomes systematic rather than guesswork.
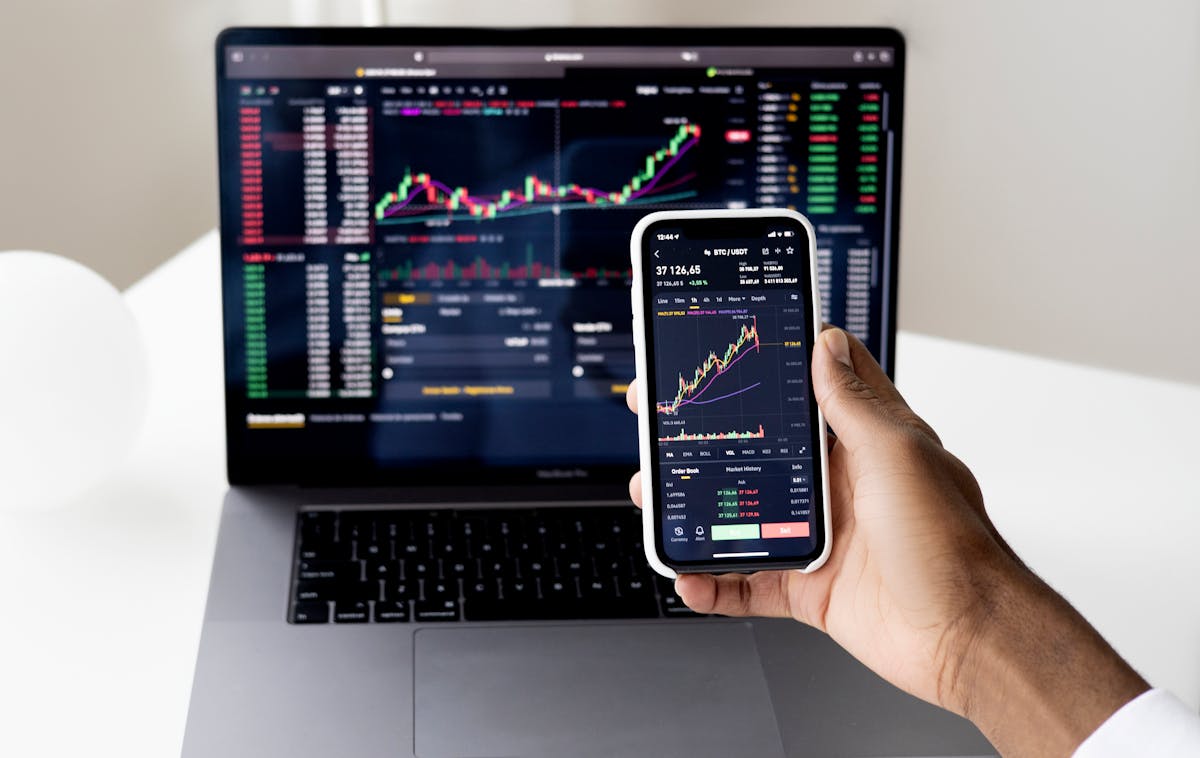
Backtesting reveals exactly how your strategy would have performed historically
What Makes TradingView the Best Platform for Strategy Building
TradingView isn't just another charting platform—it's specifically designed to make strategy creation accessible to everyone. Here's why it stands out:
- Pine Script is Beginner-Friendly: Unlike complex languages like Python or C++, Pine Script uses simple, readable syntax that mirrors how traders actually think about markets.
- Built-in Backtesting Engine: No need to download historical data, set up databases, or build testing infrastructure. It's all there, ready to go.
- Visual Feedback: See your strategy's signals plotted directly on charts. Debugging is visual and intuitive, not abstract.
- Massive Community: Thousands of open-source strategies to learn from. When you're stuck, someone has probably already solved your problem.
- Free Access: You can build and test strategies on a completely free TradingView account. No subscription required to start.
💡 Real Talk: Most traders who manually follow a system eventually fail—not because their system is bad, but because humans are terrible at following rules consistently. We get bored during losing streaks, overconfident during winning streaks, and scared at the worst possible moments. Building a strategy removes the human element from execution while keeping you in control of the logic.
What You'll Actually Build
In this guide, we're going to build a complete moving average crossover strategy with proper risk management. This is a legitimate strategy that many professional traders use (though often with additional filters). More importantly, once you understand this foundation, you'll be able to build anything.
Our strategy will:
- Automatically enter long positions when a fast moving average crosses above a slow moving average
- Exit positions when the opposite crossover occurs
- Include stop loss and take profit levels
- Show you complete performance statistics
- Display entry and exit signals visually on your chart
Prerequisites: What You Need
Before we dive in, here's everything you need (spoiler: it's not much):
- A TradingView Account: Sign up for free at tradingview.com. You don't need a paid subscription.
- 30 Minutes of Focused Time: That's genuinely all it takes to build your first strategy.
- Zero Programming Experience: Seriously. If you can follow a recipe, you can write Pine Script.
- A Basic Understanding of Trading: You should know what a moving average is and understand basic concepts like "buy" and "sell."

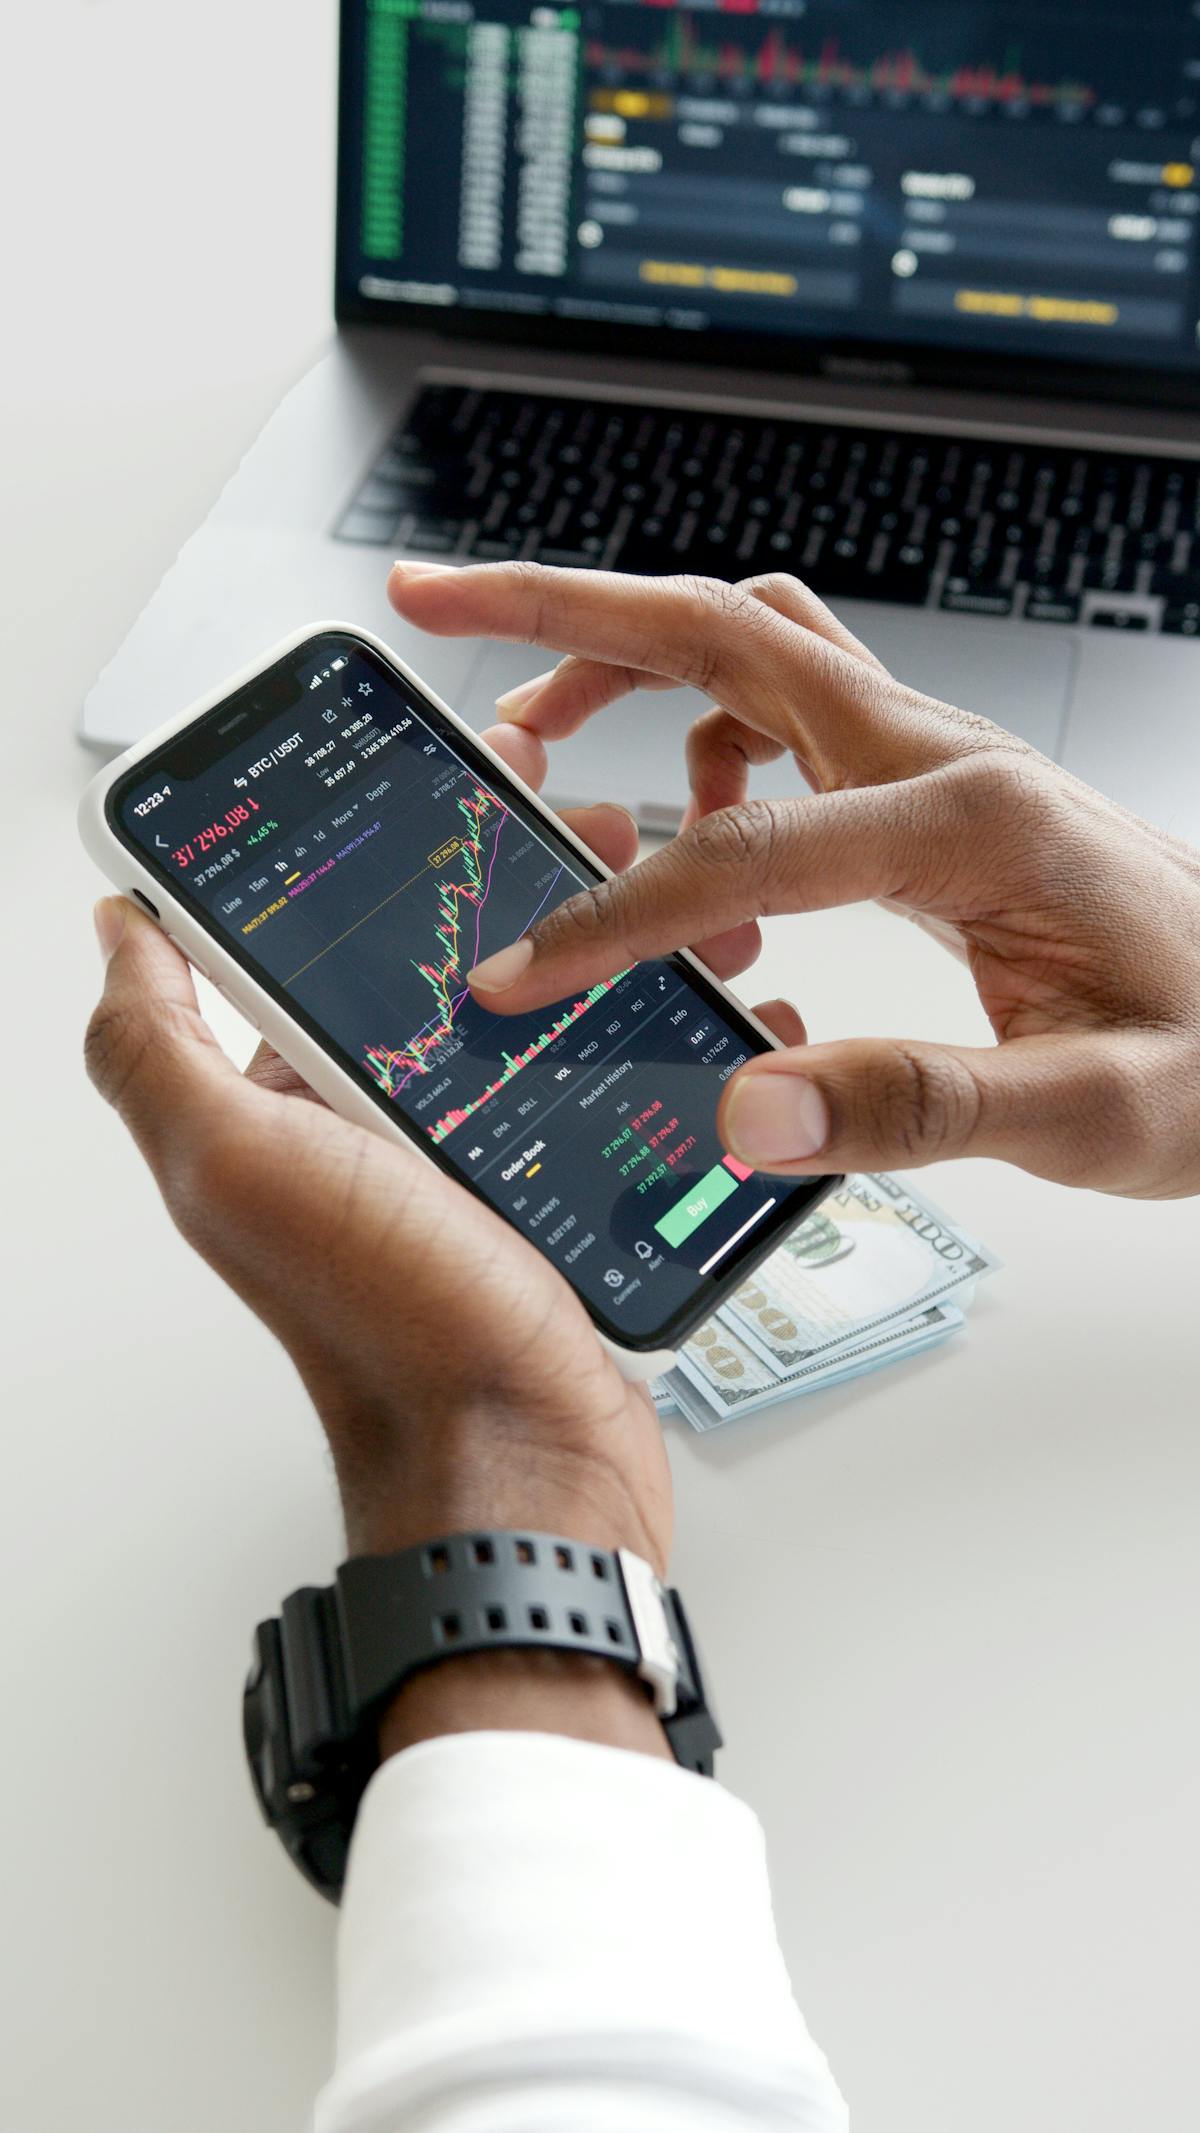
All you need is your computer and TradingView—no complex setup required
Step-by-Step: Building Your First TradingView Strategy
Let's walk through the complete process of creating your first automated trading strategy. Follow along, and in 30 minutes you'll have a working, backtested strategy running on your charts.
1 Open the Pine Script Editor
Log into TradingView and open any chart (Bitcoin, stocks, whatever you trade). At the bottom of your screen, you'll see tabs. Click on the "Pine Editor" tab. This opens your coding workspace.
You'll see some default code—ignore it for now. We're starting fresh.

The Pine Editor is where all the magic happens
2 Set Up the Strategy Foundation
Every Pine Script strategy starts with a declaration that tells TradingView what you're building. Delete everything in the editor and type this:
What this does:
//@version=5tells TradingView you're using Pine Script version 5 (the latest)strategy("My First Strategy", overlay=true)names your strategy and tells it to draw directly on the price chart
Click the "Save" button (top right), then click "Add to Chart". You won't see anything yet—that's normal!
3 Calculate Moving Averages
Now let's calculate the two moving averages our strategy will use. Add these lines below your strategy declaration:
Breaking this down:
ta.sma(close, 10)calculates a 10-period Simple Moving Averageta.sma(close, 30)calculates a 30-period Simple Moving Averageplot()draws these moving averages on your chart- Lines starting with
//are comments—they help you remember what your code does
Save and add to chart again. You should now see two moving average lines on your chart!
💡 Understanding the Numbers: The 10 and 30 in our moving averages aren't magic—they're just periods that work well for demonstration. Shorter periods (like 10) react quickly to price changes. Longer periods (like 30) smooth out noise. The crossover of these two creates our trading signal.
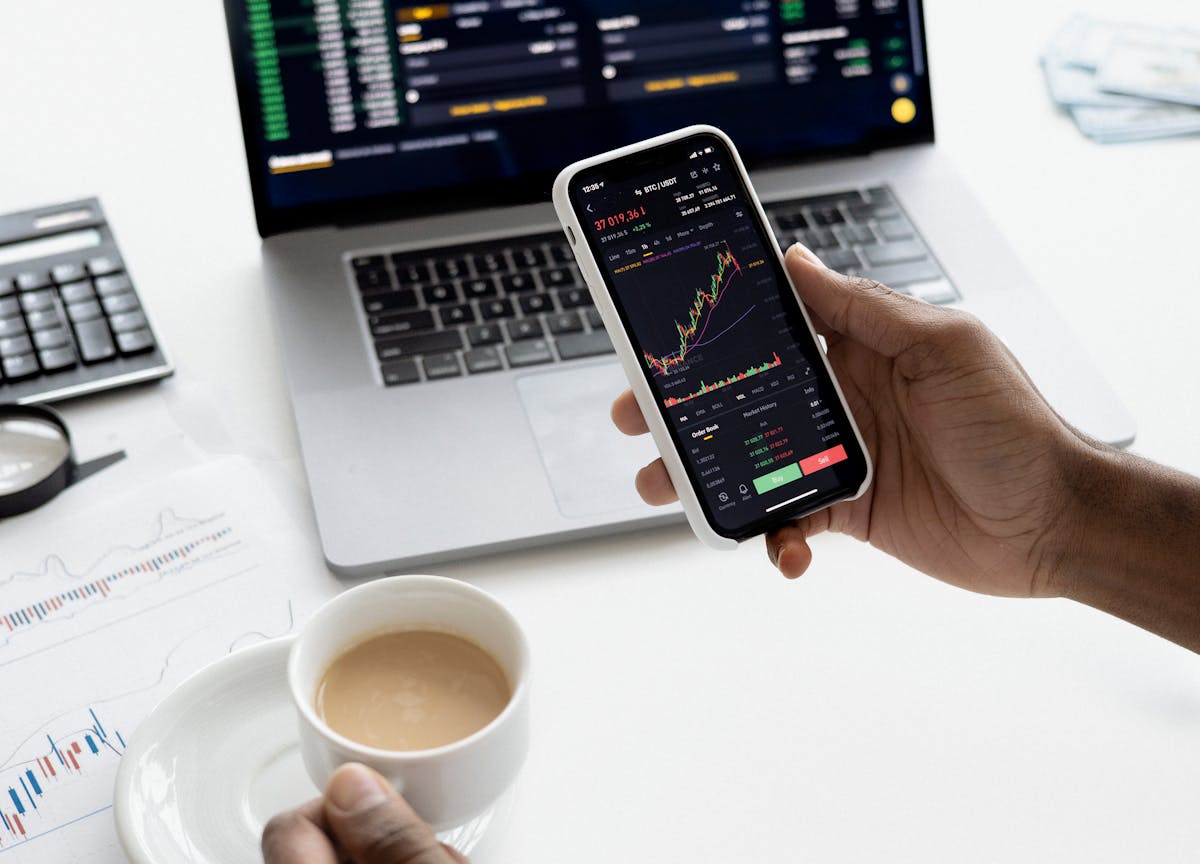
Moving average crossovers form the basis of many profitable trading strategies
4 Define Entry and Exit Conditions
Now comes the fun part—telling your strategy when to trade. Add this code:
What's happening here:
ta.crossover(fastMA, slowMA)detects when the fast MA crosses above the slow MA—our buy signalta.crossunder(fastMA, slowMA)detects when it crosses below—our sell signalstrategy.entry()opens a long positionstrategy.close()closes the position
Save and add to chart. Your strategy is now trading! Look at the bottom of your screen for the "Strategy Tester" tab to see your results.
5 Add Risk Management
A strategy without risk management is gambling. Let's add stop loss and take profit levels. Replace your trade execution code with this:
This adds crucial protection:
- If price drops 2% below your entry, you exit (stop loss)
- If price rises 4% above your entry, you take profits (take profit)
- Or you exit when the moving averages cross back (your original exit signal)
6 Visualize Signals
Let's make it crystal clear when trades happen. Add these lines at the end:
Now you'll see green up arrows where your strategy buys and red down arrows where it sells. Perfect for visual analysis!
Visual signals make it easy to understand your strategy's behavior at a glance
7 Analyze Your Results
Click the "Strategy Tester" tab at the bottom of your screen. This shows you everything:
- Net Profit: How much your strategy made or lost
- Total Trades: Number of trades executed
- Win Rate: Percentage of winning trades
- Profit Factor: Gross profit divided by gross loss (above 1.0 means profitable)
- Max Drawdown: Largest peak-to-valley drop (critical for risk assessment)
Click through the tabs to see a complete trade list, performance overview, and equity curve.
⚠️ Reality Check: Your first strategy probably won't be immediately profitable—that's completely normal and actually good! The goal right now is learning the process, not creating the perfect system. Even if your strategy shows losses, you've just built something that would have taken weeks to test manually. That's massive progress.
The Complete Code
Here's everything together for easy copy-pasting:
Making Your Strategy Better: Optimization Tips
Now that you have a working strategy, here's how to improve it:
1. Add User Inputs for Easy Testing
Replace your hard-coded numbers with input variables. Change this:
To this:
Now you can adjust these values from your strategy settings without touching the code!
2. Add a Trend Filter
Crossover strategies work great in trending markets but generate false signals when markets chop sideways. Add this filter:
This dramatically reduces false signals in choppy markets.
3. Add Volume Confirmation
Strong signals often come with increased volume. Add volume to your entry logic:

Adding filters and confirmations helps reduce false signals
4. Test Different Timeframes
A strategy that works on the 1-hour chart might fail on the 15-minute chart. Test your strategy on:
- Multiple timeframes (5min, 15min, 1H, 4H, Daily)
- Different assets (BTC, ETH, stocks)
- Various market conditions (trending, ranging, volatile)
💡 Pro Optimization Tip: Don't over-optimize! If you tweak your strategy until it shows 95% win rates on historical data, you've probably "curve-fitted" it to past price action. It will fail miserably in live trading. Keep strategies simple and robust. A 55-60% win rate with proper risk management beats a "perfect" overoptimized strategy every time.
Common Beginner Mistakes to Avoid
1. Trading Without Risk Management
Never, ever run a strategy without stop losses. One bad trade can wipe out months of gains. Always define your maximum loss per trade before entering.
2. Ignoring Commissions and Slippage
Your backtest shows 50% returns? Great! But did you account for trading fees? In strategy settings, add realistic commission rates (0.1-0.2% for crypto). Your real returns will be lower.
3. Using Unrealistic Position Sizes
Backtesting with 100% of your capital per trade shows huge returns but ignores reality. Real traders use 1-5% risk per trade. Adjust your position sizing accordingly in strategy properties.
4. Testing on Too Little Data
Testing on just the last 3 months of data means nothing. Test on at least 1-2 years to capture different market conditions. Your strategy needs to survive bull runs, corrections, and sideways chop.
5. Going Live Too Soon
You built a strategy, it shows profits, you're excited—slow down! Paper trade it for at least a month first. Watch how it performs in real-time. Does it still work when you're not looking at historical data?
Taking Your Strategy Live: The Right Way
Once you've backtested thoroughly and paper traded successfully, here's how to transition to live trading:
- Start Small: Use 10-20% of your intended capital at first. Prove the strategy works in real conditions before scaling up.
- Set Up Alerts: Use TradingView alerts to notify you of entry signals. Even with a "automated" strategy, monitor the first few weeks closely.
- Keep a Trading Journal: Document every trade. Note market conditions, how you felt, any deviations from your plan.
- Review Weekly: Analyze your strategy's performance every week. Are results matching backtests? What's different?
- Be Patient: Give your strategy at least 50-100 trades before judging its effectiveness. Three losing trades doesn't mean it's broken.
Ready to Calculate Your Perfect Position Size?
Building a strategy is step one. Proper position sizing is step two. Our free trading calculator helps you determine exactly how much to risk on each trade based on your account size and risk tolerance.
Try Our Free Position Size CalculatorNext Steps: Leveling Up Your Strategy Development
You've built your first strategy—congratulations! Here's where to go from here:
Learn More Pine Script Functions
- RSI:
ta.rsi(close, 14)for overbought/oversold conditions - MACD:
ta.macd(close, 12, 26, 9)for momentum - Bollinger Bands:
ta.bb(close, 20, 2)for volatility - ATR:
ta.atr(14)for dynamic stop losses
Study Successful Strategies
TradingView's Public Library contains thousands of open-source strategies. Find ones that interest you, study their code, understand their logic. This is how you learn fastest.
Join the Community
The TradingView community is incredibly helpful. When you're stuck:
- Search the Pine Script documentation
- Ask in TradingView's Pine Script chat
- Read educational articles and watch video tutorials
Combine Multiple Indicators
The most robust strategies combine 2-3 indicators for confirmation. Try:
- Moving Average + RSI
- MACD + Volume
- Bollinger Bands + Trend Filter
Continuous learning and iteration are key to strategy development success
The Philosophy of Strategy Development
Before we wrap up, let's talk mindset. Building trading strategies isn't about finding the "holy grail"—it doesn't exist. It's about:
- Process Over Profits: Focus on building robust systems, not chasing big returns. Good process leads to consistent profits.
- Simplicity Wins: Complex strategies with 15 indicators usually underperform simple, well-executed ideas.
- Adaptation Matters: Markets change. What worked in 2023 might not work in 2026. Regularly review and update your strategies.
- Risk First, Returns Second: Protect your capital above all else. You can't compound gains if you blow up your account.
- Patience Pays: Strategy development is a marathon, not a sprint. Give yourself time to learn and improve.
The Real Secret
Here's what nobody tells you: The secret to successful strategy trading isn't finding the perfect indicator combination or magical parameter values. It's having the discipline to:
- Follow your rules even when you don't want to
- Take losses gracefully without revenge trading
- Stay patient during losing streaks
- Not overtrade during winning streaks
Building a strategy forces this discipline. That's its real value.
Conclusion: You're Now a Strategy Builder
You started this article as someone who manually watches charts and makes discretionary trading decisions. You're finishing it with the knowledge to build, test, and deploy automated trading strategies.
That's transformative.
The strategy you built today—the simple moving average crossover—is just the beginning. You now understand:
- How to write Pine Script code
- How to calculate indicators programmatically
- How to define entry and exit conditions
- How to add risk management
- How to visualize signals
- How to interpret backtest results
More importantly, you have a framework. Every strategy you build from now on will follow this same process: define your logic, code it, test it, refine it, deploy it.
The traders who succeed long-term aren't the ones with the most exotic indicators or secret knowledge. They're the ones who systematically test ideas, follow their rules consistently, and manage risk properly.
You now have the tools to join their ranks.
💡 Your Next Action: Don't close this tab and forget what you learned. Open TradingView right now and build the strategy we just covered. Spend 30 minutes doing it yourself. Muscle memory beats reading every time. Make mistakes, debug them, see your first backtest results. That's how you truly learn.
Master Risk Management for Your Strategies
Building strategies is powerful, but proper position sizing determines whether you profit or blow up. Use our professional trading tools to calculate risk, analyze Bitcoin options, and track your performance.
Explore Our Free Trading ToolsNow go build something. Your first strategy won't be perfect—but it will be yours. And that's what matters.